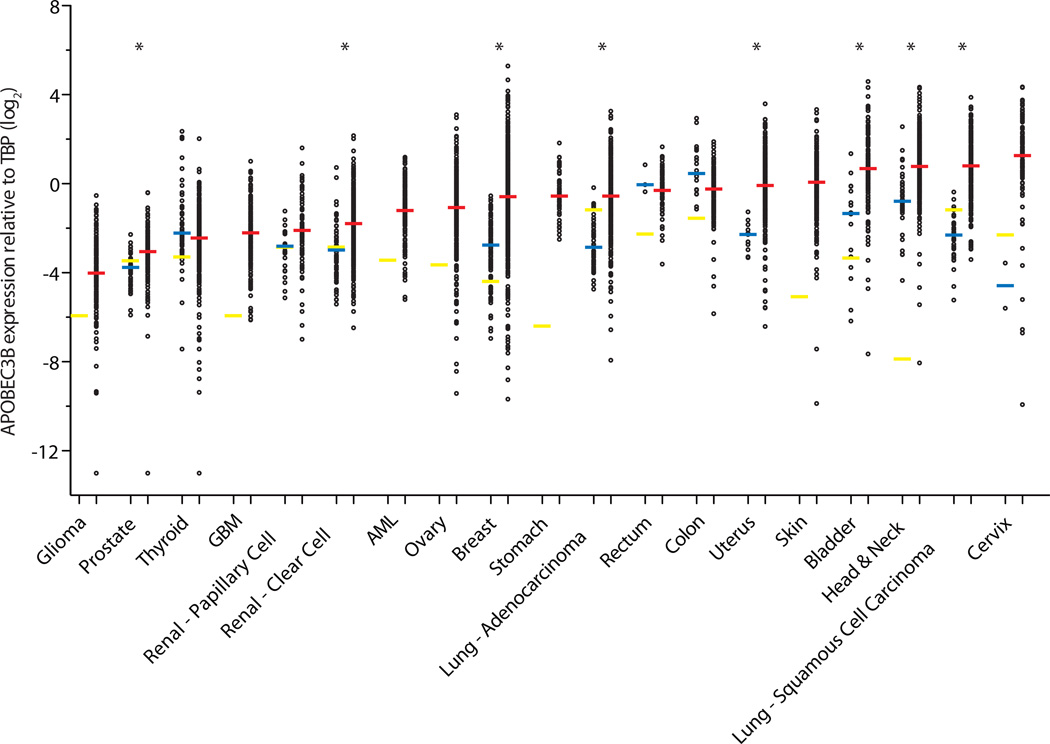
Figure 1. APOBEC3B is upregulated in numerous cancer types.
Each data point represents one tumor or normal sample, and the Y-axis is log-transformed for better data visualization. Red, blue, and yellow horizontal lines indicate the median APOBEC3B/TBP value for each cancer type (Table 1), the median value for each set of normal tissue RNAseq data (Supplementary Table 1), and individual RT-qPCR data points, respectively. Asterisks indicate significant upregulation of APOBEC3B in the indicated tumor type relative to the corresponding normal tissues (p<0.0001 by Mann-Whitney U-test). P-values for negative or insignificant associations are not shown.

