
Figure 1.
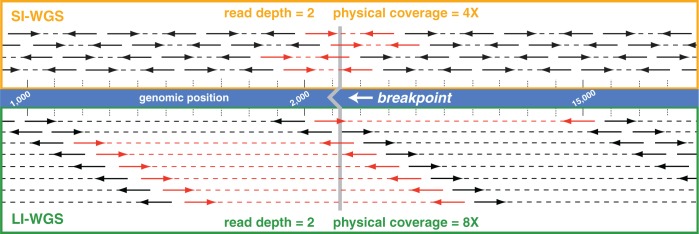
Comparison of SI- and LI-WGS. A visualization of mapped reads for SI- and LI-WGS is shown assuming a read depth of 2 for each library type. The reference human genome is shown in the middle of the figure, and the location of a theoretical breakpoint is shown in gray with the location of the breakpoint marked by the gray line. SI (300 bp) mapped reads are displayed above the reference, and LI (900 bp) mapped reads are displayed below the reference. PE reads are represented by heavy solid lines with arrowheads and regions between reads are denoted by a dotted line. Anomalous read pairs are shown in red. Higher physical coverage is achieved for LI-WGS libraries when sequencing to the same read depth for SI- and LI-WGS libraries. Furthermore, by interrogating a larger genomic region using LIs, the likelihood that a breakpoint will fall within that region is increased.