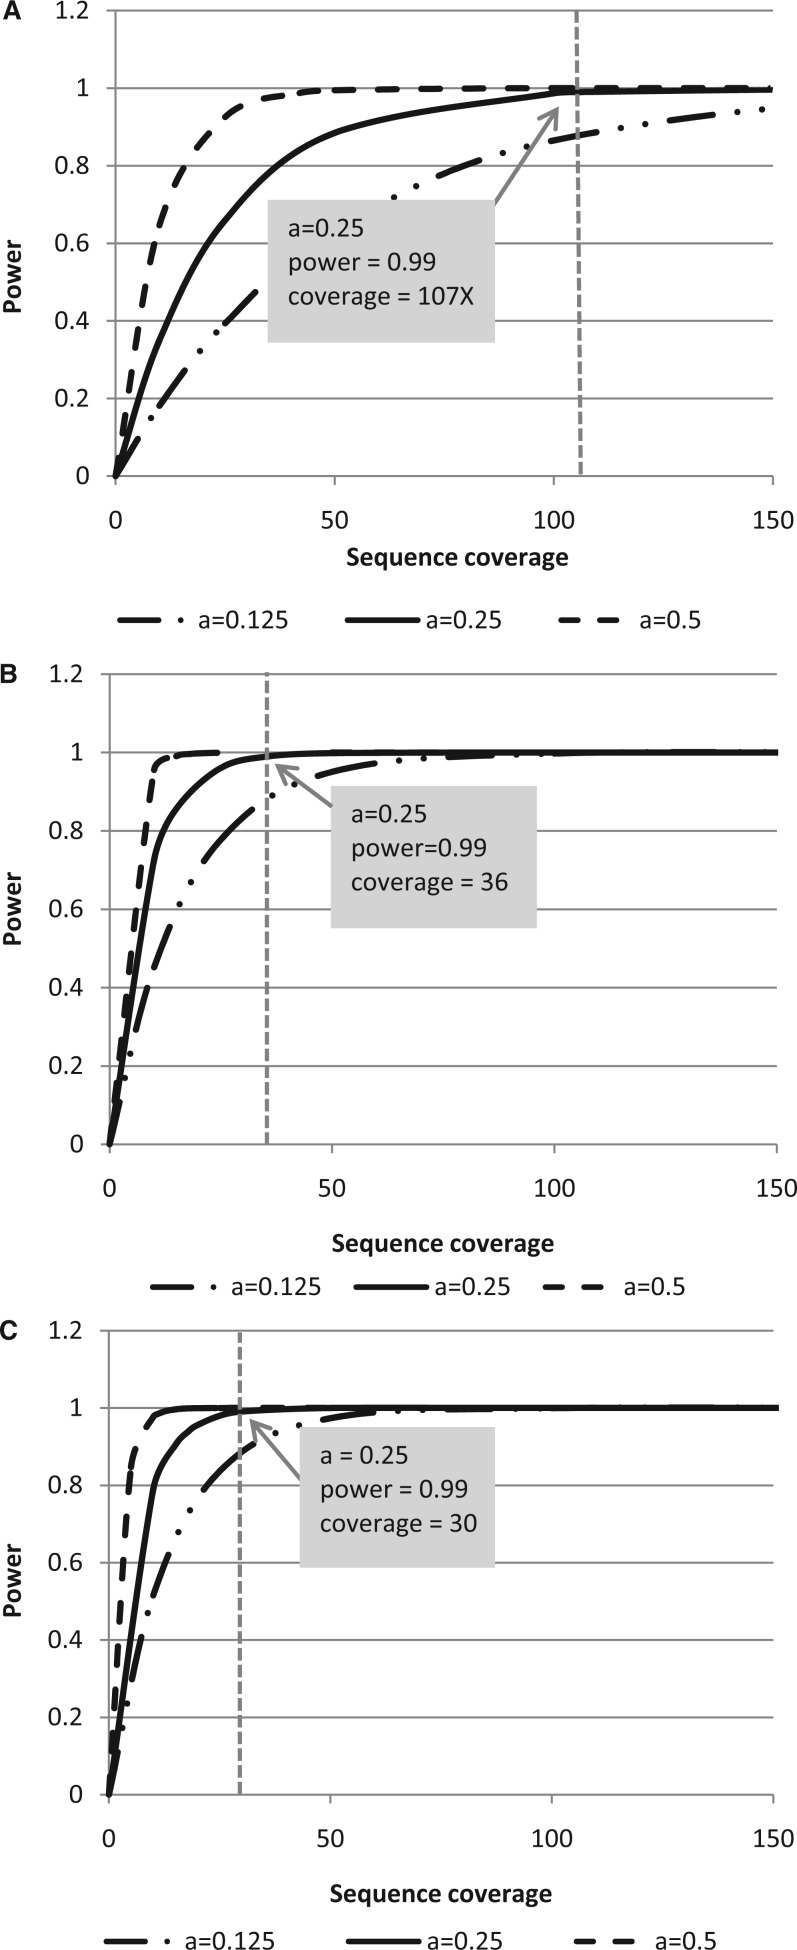
Figure 2.
Comparison of power achieved when sequencing LI or SI libraries. Power calculations were performed to evaluate the power achieved when sequencing SI (300 bp) libraries with a 2 × 100 read length (A). These analyses were performed to determine the power of identifying a heterozygous somatic event as characterized by at least 10 anomalous read pairs under three scenarios where a tumor sample may have three different tumor cellularities (100, 50, 25% tumor). This analysis was similarly performed for LI (900 bp) libraries with a 2 × 100 read length (B). We performed additional LI analyses using the same parameters but decreased the read length from 2 × 100 to 2 × 83 (C). For all three analyses, a dotted line demarcates the sequence coverage needed for detecting a heterozygous event in a sample with 50% tumor cellularity and 0.99 power. Coverage shown is sequence coverage, and a is the expected frequency of an event given the different tumor cellularities.

