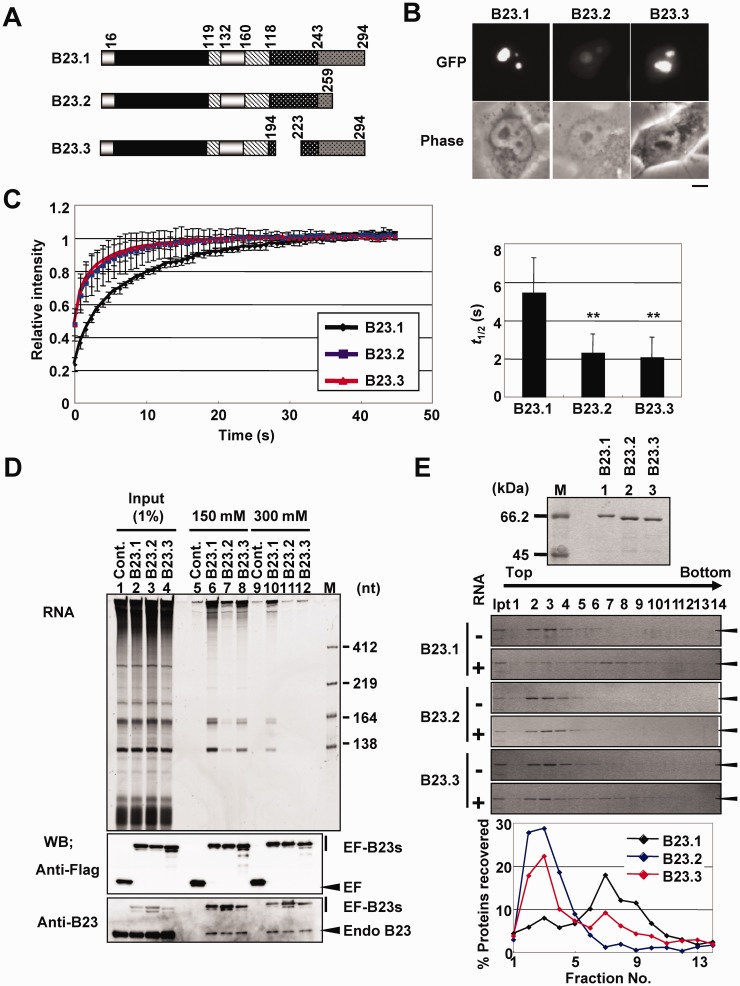
Figure 1.
Characterization of B23 variants. (A) Schematic representation of B23 splicing variants. Black, oligomerization domain; stripes, acidic regions; black with white dots, basic region; dark gray with black dots, CTD. (B) Localization of EF-tagged B23 variants. HeLa cells were transfected with vectors for expression of EF-B23.1, EF-B23.2 and EF-B23.3. Localization of the protein was observed by fluorescent microscope. Bar at the bottom indicates 10 µm. (C) FRAP analysis of B23 variants. The mobility of EF-B23 proteins expressed in HeLa cells as in Figure 1B were examined by FRAP assay. The fluorescence at the bleached nucleoli relative to that before bleaching (1.0) was calculated and plotted as a function of time. The data were represented as mean values ± SD from 15, 15 and 13 experiments for B23.1 (black), B23.2 (blue) and B23.3 (red), respectively. The t1/2 of fluorescence recovery was estimated by curve fitting and graphically represented (right panel). P-values were calculated by t-tests and indicated with **P < 0.01. (D) Immunoprecipitation of EF-tagged B23 variants. 293T cells expressing EF, EF-B23.1, EF-B23.2 and EF-B23.3 (lanes 1–4, respectively) were subjected to immunoprecipitation with anti-Flag tag antibody in the buffer containing 150 mM (lanes 5–8) or 300 mM (lanes 9–12) of NaCl. Precipitated proteins were separated by SDS–PAGE and detected with western blotting using anti-Flag tag, and -B23 antibodies (bottom panels). RNAs co-precipitated with EF-tagged proteins were purified and separated on 6% denaturing PAGE and visualized by Gel Red staining (top panel). Lane M indicates RNA molecular markers. (E) RNA binding activity of B23 variants. Recombinant GST-tagged B23 proteins were analyzed by SDS–PAGE followed by CBB staining (top panel). Purified proteins (5 µg) were incubated in the absence or presence of total RNA (10 µg) prepared from 293T cells and loaded on a 15–40% sucrose gradient. Proteins in fractions collected from the top were analyzed by SDS–PAGE and visualized by CBB staining. For the experiments incubated with RNA, the amount of the B23 proteins in each fraction relative to that of input was calculated and shown in graph (bottom panel).

