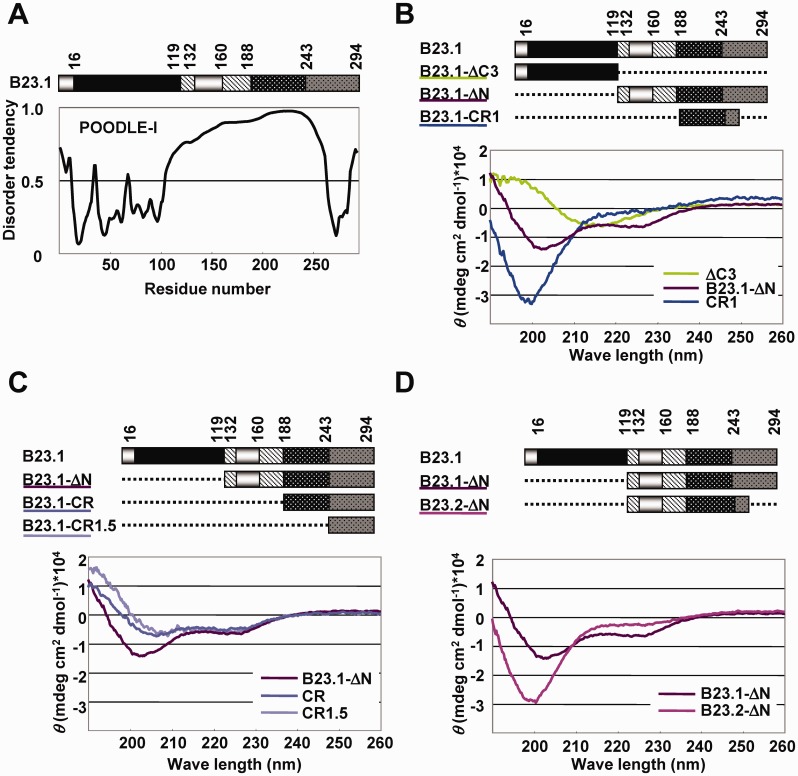
Figure 2.
Structural analysis of aIDR and bIDR. (A) Prediction of disorder tendency of B23.1. B23.1 structure was schematically represented at the top. The patterns in the scheme are as defined in the legend of Figure 1A. Disorder tendency of B23.1 was predicted using POODLE-I. (B–D) CD spectral analyses of B23 mutants. His-tagged B23 mutant proteins (5 µM) were analyzed. His-B23.1-ΔC (green), His-B23.1-ΔN (purple) and His-B23.1-CR1 (blue) (B). His-B23.1-ΔN (purple), His-B23.1-CR (blue) and His-B23.1-CR1.5 (light purple) (C). His-B23.1-ΔN (purple) and His-B23.2-ΔN (pink) (D).

