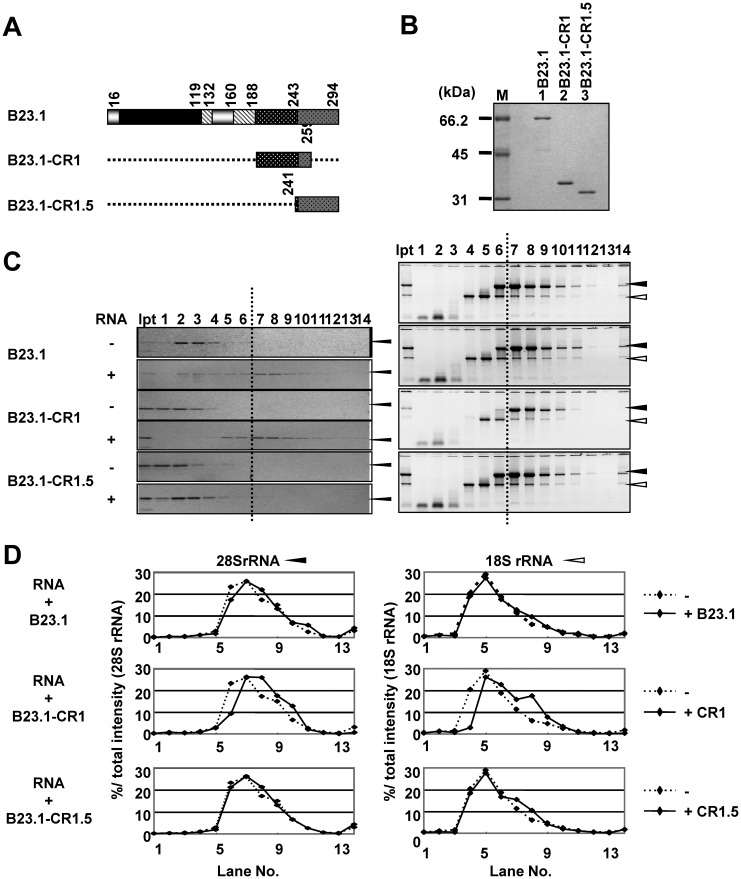
Figure 3.
The RNA binding activity of bIDR and CTD of B23.1. (A) Schematic representation of B23.1 and mutants. The patterns in the scheme are as defined in Figure 1A. (B) Recombinant GST-tagged B23.1 and its mutant proteins were analyzed by SDS–PAGE followed by CBB staining. Lane M indicates molecular markers. (C) Sucrose density gradient centrifugation assays. The RNA binding activities of GST-tagged B23.1 and mutant proteins were examined by Sucrose gradient centrifugation as in Figure 1E. Proteins in fractions were analyzed by SDS–PAGE and visualized by CBB staining (left panels). RNA alone (right top panel) and RNAs preincubated with B23 proteins were purified from each fraction, separated on 1% denatured agarose gels and visualized by Gel Red staining (right panels). (D) Distribution pattern of 28S and 18S rRNAs. The amounts of 28S (left panels) and 18S rRNAs (right panels) in each fraction in Figure 3C right panels relative to total 28S and 18S rRNAs were calculated and shown in graphs. Dashed lines in each graph indicate the sucrose gradient results of RNAs in the absence of proteins (Figure 3C, top right panel).

