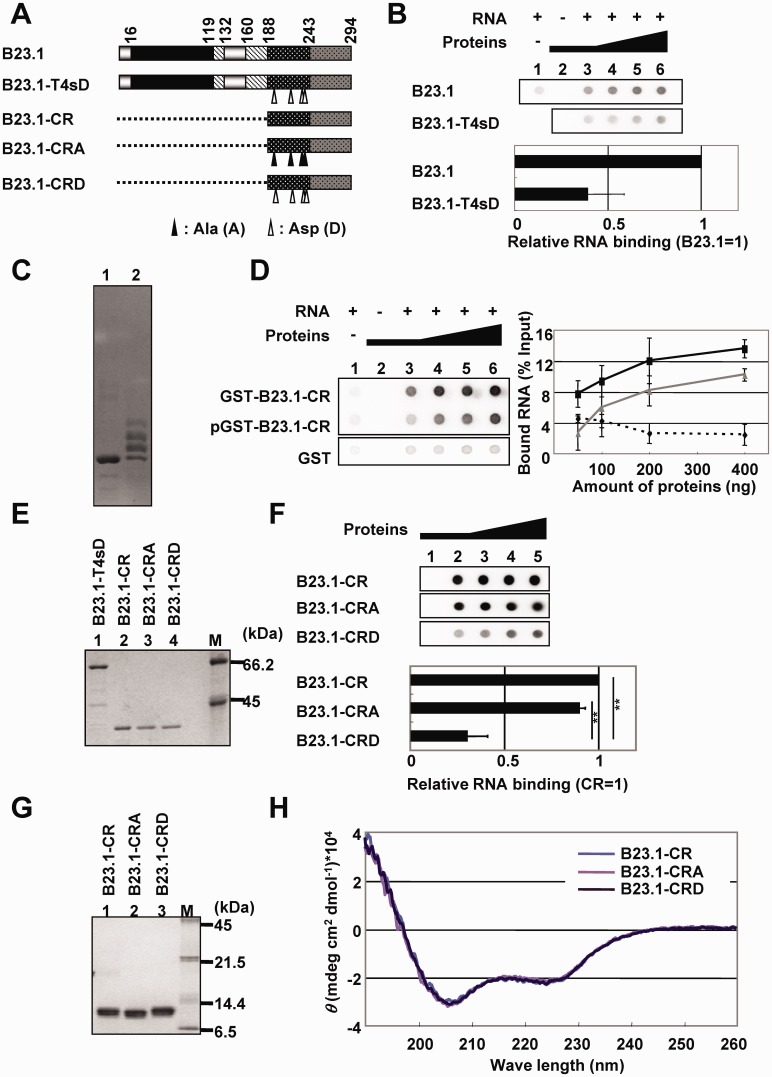
Figure 4.
The effect of mitotic phosphorylation on the RNA binding activity of bIDR. (A) Schematic representation of B23.1 and unphosphorylatable or phospho-mimetic CR mutants. B23.1-T4sD is a mutant in which threonine residues shown by arrowheads are replaced with aspartic acid (D), and B23.1-CRA and B23.1-CRD are B23.1-CR mutants in which the same residues are replaced with alanine (A) and aspartic acid (D), respectively. (B) RNA binding activity of B23.1 and phospho-mimetic mutant. GST-B23.1 and GST-B23.1-T4sD (50, 100, 200 and 400 ng for lanes 3–6, respectively) were mixed with (lanes 3–6) or without (lane 2) 32P-labeled total RNA (10 ng). RNA alone was also examined (lane 1). The intensity of each spot was analyzed by FLA7000, and the RNA binding activity obtained with the same amount of B23 proteins were calculated relative to that of B23.1 (1.0). The relative RNA binding activity at each protein amount was averaged. Means ± SD obtained from twice of duplicate independent experiments are shown (bottom panel). (C) Phosphorylation of GST-B23-CR. GST-B23.1-CR was incubated with mitotic extracts in the absence (lane 1) or presence (lane 2) of 3 mM ATP. The incubated proteins were analyzed by phos-tag SDS–PAGE and visualized by CBB staining. (D) The RNA binding activity of GST, unphosphorylated GST-B23.1-CR and phosphorylated GST-B23.1-CR (pGST-B23.1-CR) were examined for filter binding assays as in (B). The bound RNA for each amounts of GST (dashed line), GST-B23.1-CR (black line) and GST-B23.1-CRD (gray line) were plotted and shown in the right panel. (E) Recombinant GST-tagged B23 proteins were analyzed by SDS–PAGE followed by CBB staining. Lane M indicates molecular markers. (F) RNA binding activity of B23.1-CR mutants. Filter binding assays were carried out as described in (B) using GST-B23.1-CR, -CRA and -CRD. The amount of RNA retained on the membrane with GST-B23.1-CR is set as 1.0. Statistical P-values were calculated by t-tests and indicated with **P < 0.01. (G) Recombinant His-tagged B23.1-CR, -CRA and -CRD were analyzed by SDS–PAGE and visualized by CBB staining. Lane M indicates molecular markers. (H) CD spectral analysis of B23.1-CR, B23.1-CRA and B23.1-CRD. CD spectra of B23.1-CR (blue gray), B23.1-CRA (light purple) and B23.1-CRD (purple) (5 µM) were analyzed.

