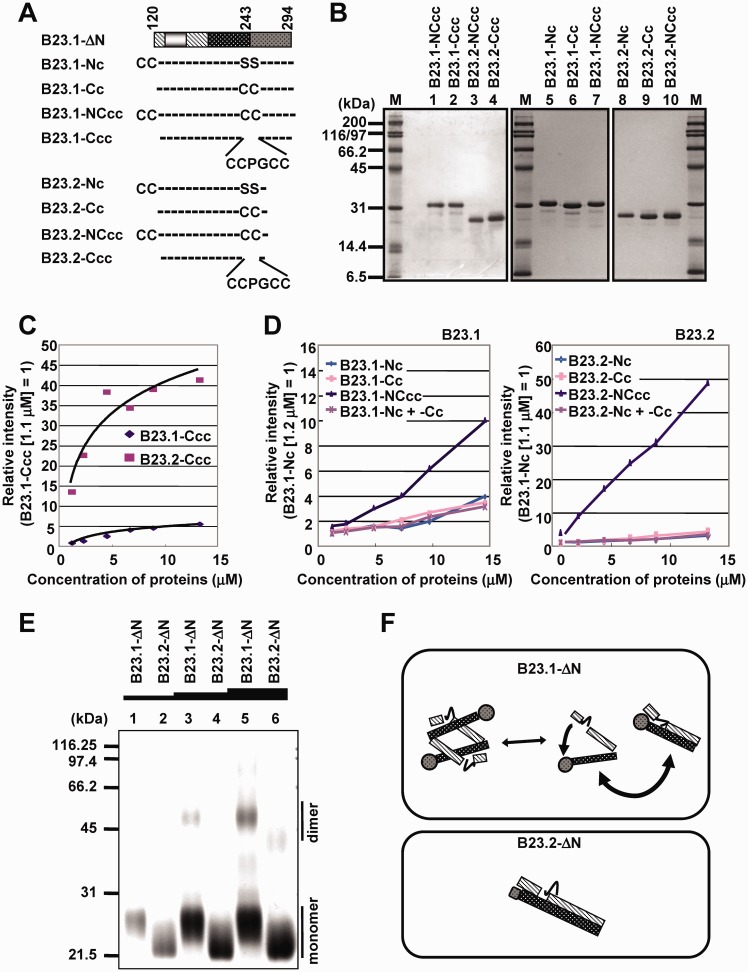
Figure 7.
Intra- and inter-molecular interaction between two IDRs of B23.1 and B23.2. (A) Schematic representation of B23 mutants. B23.1/B23.2-ΔN and their Cys–Cys-tagged mutants are schematically represented. The patterns in the scheme of B23.1-ΔN are as defined in Figure 1A. N-terminal Cys–Cys tag was represented as CC- (Cys–Cys-). C-terminal Cys-Cys-tag was introduced by replacement of serines [S] 242 and 243 with cysteines [C], and represented as -CC-. Tetracysteine-tag (Cys–Cys–Pro–Gly–Cys–Cys, CCPGCC) was introduced into the same site with -CC-. (B) Purified proteins. The Cys-Cys-tagged mutant proteins (200 ng) as indicated at the top of each lane were separated by SDS–PAGE and visualized with CBB staining. (C) FlAsH labeling of B23.1-Ccc and B23.2-Ccc. His-tagged B23.1-Ccc (diamond) or B23.2-Ccc (square) (1.1, 2.2, 4.4, 6.6, 8.8 and 13.2 µM) was incubated with 10 µM of FlAsH-EDT2 for 30 min at room temperature, and the fluorescence intensity was recorded with Varioskan. (D) FlAsH labeling of B23 mutants. His-tagged B23-Nc (light blue), B23-Cc (pink), B23-NCcc (purple) and mixture of B23-Nc and B23-Cc (light purple line) [1.2, 2.4, 4.9, 7.3, 9.7 and 14.4 µM (B23.1), or 1.1, 2.2, 4.4, 6.6, 8.8 and 13.2 µM (B23.2)] were examined for FlAsH labeling assay as in (B). (E) Cross-link assay. His-tagged B23.1-ΔN and B23.2-ΔN (1.5, 3.0 and 4.5 µM) (lanes 1 and 2, 3 and 4 and 5 and 6) were incubated in the presence of 0.1% Glutaraldehyde for 10 min, separated on SDS–PAGE, and visualized by CBB staining. Positions of size markers are indicated at the left of the panel. (F) A model for B23.1-ΔN and B23.2-ΔN structures. The globular structure of CTD is illustrated by circle, and stripes and black with white dots bars indicate aIDR and bIDR, respectively.

