Figure 1.
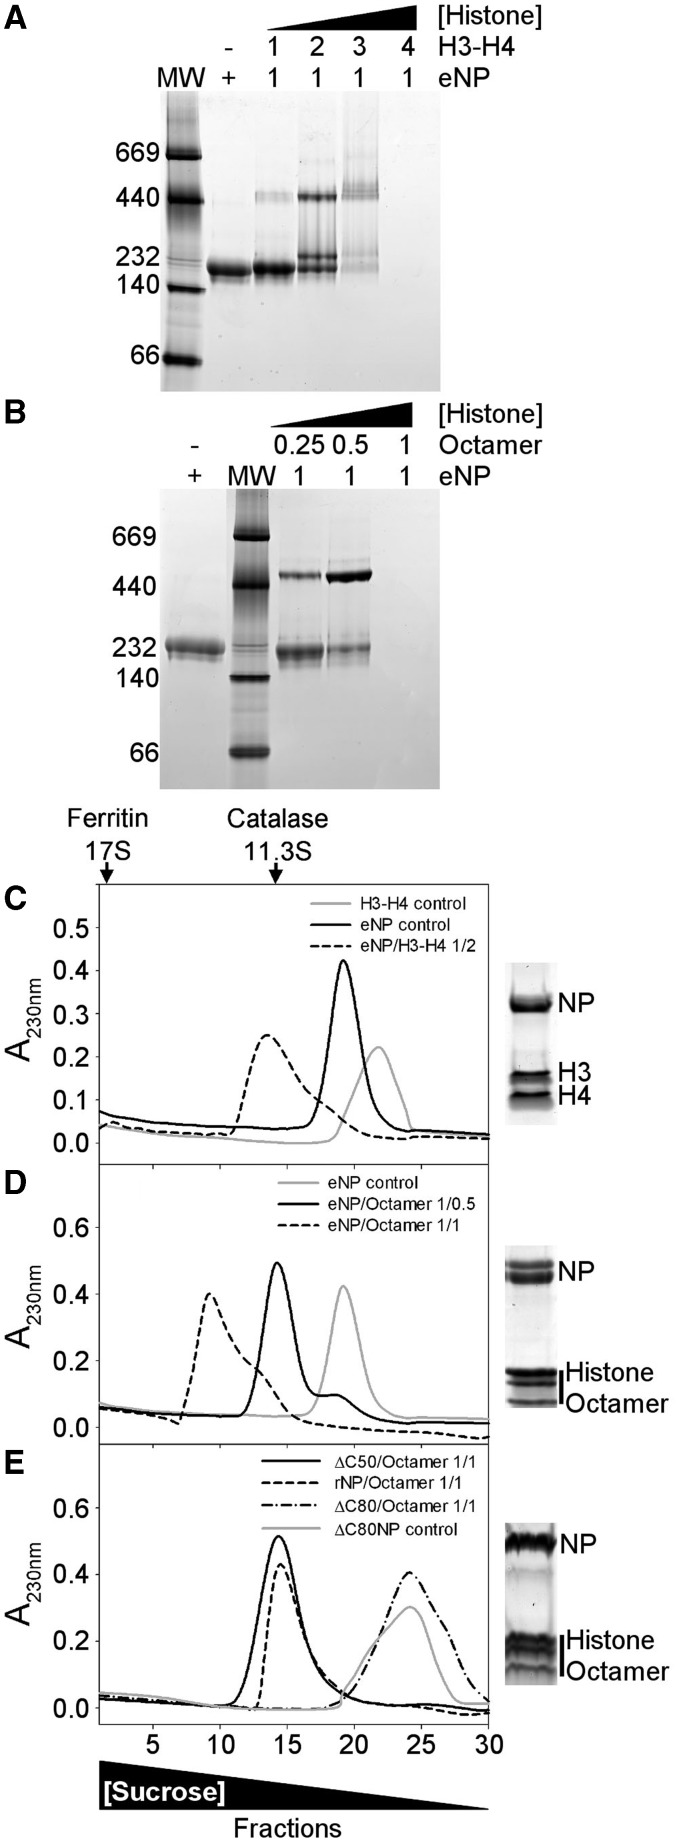
Analysis of NP/H3-H4 and NP/histone octamer complexes. (A) eNP was titrated with H3-H4 and complex formation, at the indicated eNP/H3-H4 molar ratios, followed by 4–16% Native-PAGE. The MW markers position (left lane) and a triangle showing the increase in H3-H4 concentration are also shown. (B) eNP was mixed with increasing amounts of histone octamer, and the samples were analyzed by Native–PAGE. Other details as in (A). (C) Sucrose gradient fractionation of the eNP/H3-H4 1/2 complex. Absorbance at 230 nm of the gradient fractions of H3-H4 control (gray solid line), eNP control (black solid line), and eNP/H3-H4 1/2 complex (dashed line). SDS–PAGE of fraction 13 of the eNP/H3-H4 complex. (D) Sucrose gradient fractionation of NP/octamer complexes. A230 of the gradient fractions corresponding to eNP control (gray solid line), eNP/octamer 1/0.5 (black solid line), and eNP/octamer 1/1 complex (dashed line). SDS–PAGE of fraction 14 of the eNP/octamer (1/0.5) complex. (E) Sucrose gradient fractionation of rNP mutants/octamer complexes. A230 of the fractions corresponding to ΔC50NP/octamer 1/1 (black solid line), rNP/octamer 1/1 (dashed line), ΔC80NP/octamer 1/1 (dashed-dotted line) complexes, and to ΔC80NP alone (gray solid line). SDS–PAGE of fraction 14 of the rNP/octamer (1/0.5) complex. The triangle in the lower part of the figure shows changes in sucrose concentration. The migration of two control proteins, catalase (232 kDa, 11.3 S) and ferritin (440 kDa, 17 S), is marked in the upper part of panel (C).

