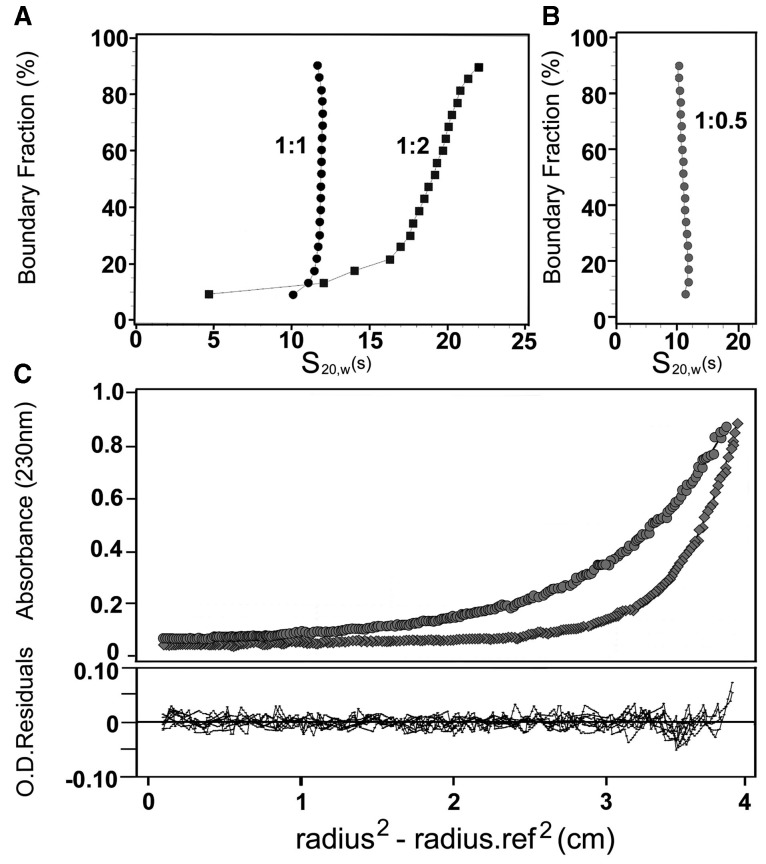
Figure 2.
Analytical ultracentrifugation analysis of NP/histone complexes. (A) Sedimentation velocity analysis of eNP/H3-H4 complexes at 1/1 and 1/2 molar ratios, and (B) of the eNP/octamer (1/0.5 molar ratio) complex. (C) Sedimentation equilibrium analysis of the eNP/octamer (1/0.5 molar ratio) complex. The top panel shows the absorbance at 230 nm as a function of the square of the radial distance of the sample at any position within the cell (r) minus the square of the radial position at a reference point (r0) (r2-r02). The continuous lines in these plots were obtained by fitting the experimental data to a single ideal species with Mr of ∼307 kDa. The bottom plot shows X2 residuals as a function of r-r02 for the best fit (solid lines). The run was performed at 4°C and 8000 (circles) and 12 000 (diamonds) rpm.

