Figure 3.
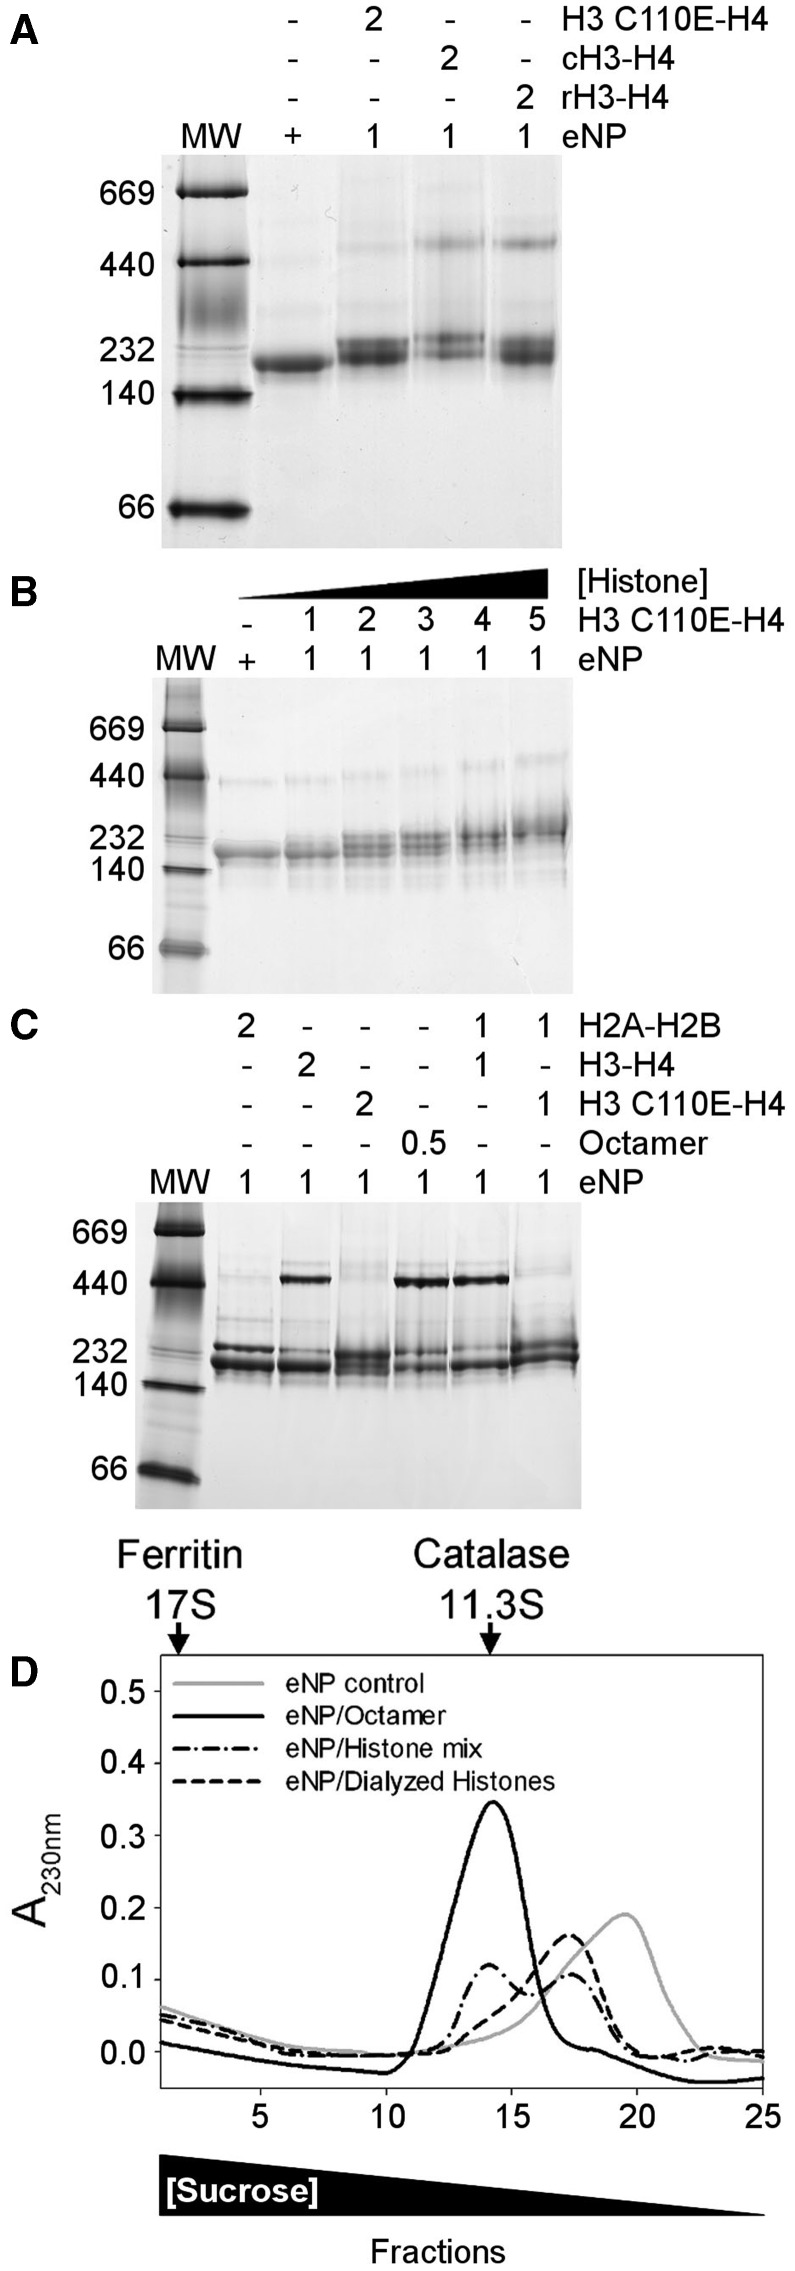
NP binds differently H3-H4 dimers and tetramers. (A) Comparison of the complexes formed by eNP and recombinant H3C110E-H4, chicken H3-H4 (cH3-H4), or recombinant H3C110A-H4 (rH3-H4) at a 1/2 molar ratio. (B). Titration of eNP with recombinant H3C110E-H4, as seen by Native–PAGE. eNP control and eNP/H3C110E-H4 complexes at increasing histone concentration. (C) Comparison of the following eNP/histone complexes: eNP/H2A-H2B 1/2; eNP/H3-H4 1/2; eNP/H3C110E-H4 1/2; eNP/octamer 1/0.5; eNP/H2A-H2B/H3-H4 1/1/1; and eNP/H2A-H2B/H3C110E-H4 1/1/1. In the last two samples, the histone components were added simultaneously from 2 M NaCl stock solutions to NP containing samples. In all panels, the molar ratios of the different eNP/histone complexes are indicated in the upper part of the gels. (D) Sucrose gradient fractionation of eNP control (gray solid line), eNP/octamer 1/0.5 complex (black solid line), eNP/H2A-H2B/H3-H4 1/0.5/0.5 complex (black dashed-dotted line), and eNP/H2A-H2B/H3-H4 1/0.5/0.5 complex prepared using histones extensively dialyzed against buffer containing 0.24 M NaCl (black dashed line). The triangle in the lower part of the figure shows changes in sucrose concentration. The migration of the control proteins catalase (232 kDa, 11.3S) and ferritin (440 kDa, 17S) is marked with arrows in the upper part of panel D.

