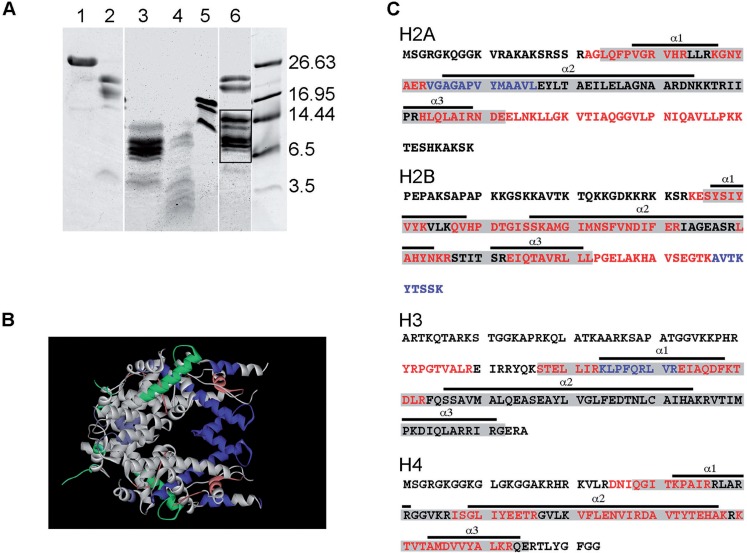
Figure 6.
Mass spectrometry analysis of the tryptic peptides obtained from eNP/octamer complexes. (A) 12.5% Tris–Tricine gel electrophoresis of the tryptic peptides obtained from eNP/octamer (1/1 molar ratio) complexes. The peptides from the bands highlighted within the box were analyzed by MS/MS. 1, eNP control; 2, eNP digested in 0.24 M NaCl; 3, octamer trypsinized in 2 M NaCl; 4, octamer digested in 0.24 M NaCl; 5, octamer control; 6, eNP/octamer 1/0.5 complex digested in 0.24 M NaCl. All samples were incubated with trypsin for 30 min. (B) Structure of the histone octamer (entry 1TZY in PDB). Shown in white are the tryptic peptides identified by mass spectrometry for H2A (green), H2B (turquoise), H3 (blue) and H4 (red). (C) Amino acid sequence of H2A (accession number P70082), H2B (accession number P02279), H3 (accession number 0806228A) and H4 (accession number U37576.1) showing the HFD (gray boxes) and its three helixes (underlined). The peptides protected in the complex (white in panel B) are highlighted in red. Additional information obtained using GluC for sample digestion is highlighted in blue.

