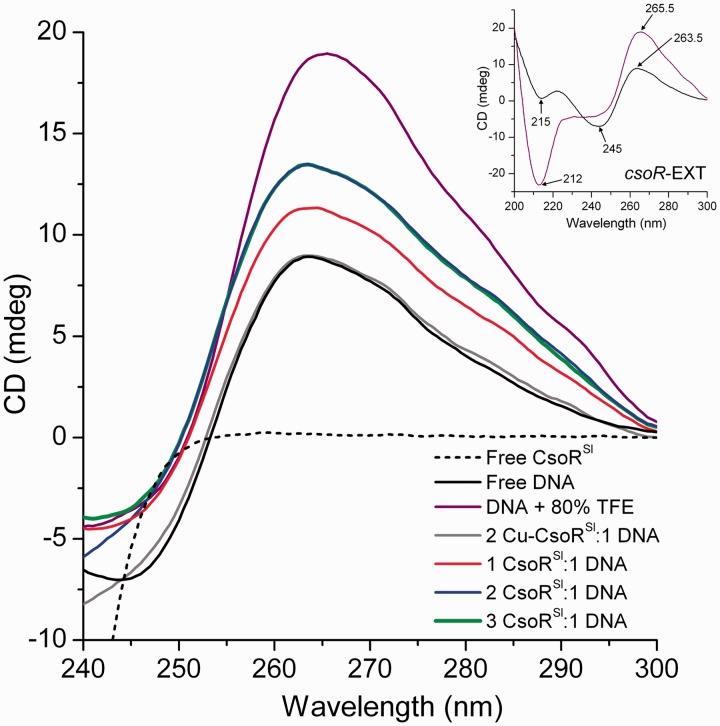
Figure 5.
CsoRSl binding to csoR-EXT enhances A-DNA traits. Insert, the CD spectrum of csoR-EXT (black) in aqueous solution at pH 7.5 reveals a positive ellipticity at 263.5 nm consistent with A-DNA characteristics ascribed to its G-tract palindromes and retains the same ellipticity in the 260 nm region on induction of true A-DNA form in 80% TFE (purple). No signals from CsoRSl contribute in the near-UV CD spectrum (black dashed), whereas the ellipticity of csoR-EXT (10 µM) in the near-UV region changes in the presence of one (40 µM) and two molar equivalents (80 µM) of CsoRSl (blue) with no further change in the presence of three molar equivalents (120 µM) of CsoRSl (green). At two molar equivalents of Cu(I)-CsoR (grey), the near-UV CD spectrum of csoR-EXT is the same as in the absence of the apo-CsoRSl. All curves of protein–DNA complexes were baselined with appropriate concentrations of protein and buffer.

