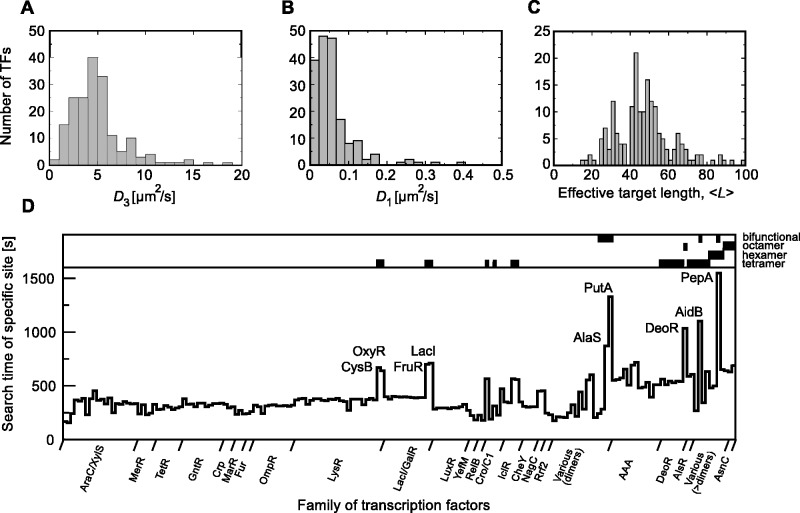
Figure 3.
Analysis of TF mobility and kinetic parameters for the set of recognized TFs (Supplementary Table S2) from E. coli EcoCyc (58) and RegulonDB (59) databases. Histograms of TF (A) three-dimensional, D3 [Equation (1)] and (B) one-dimensional diffusion constants, D1 [Equation (2)]. (C) The histogram of the effective target enhancement factors  [Equation (7)]. (D) The average time for the location of single specific binding site by TFs [
 ]. For simplicity, we assume that
  . TFs are grouped into families (the order is the same as in Supplementary Table S2). In the upper belt of the panel (D), TFs that form stable higher oligomers (oligomerization level higher than 2) and/or are bifunctional (TF poses DNA binding domain and various enzymatic activity) are marked with black stripes.

