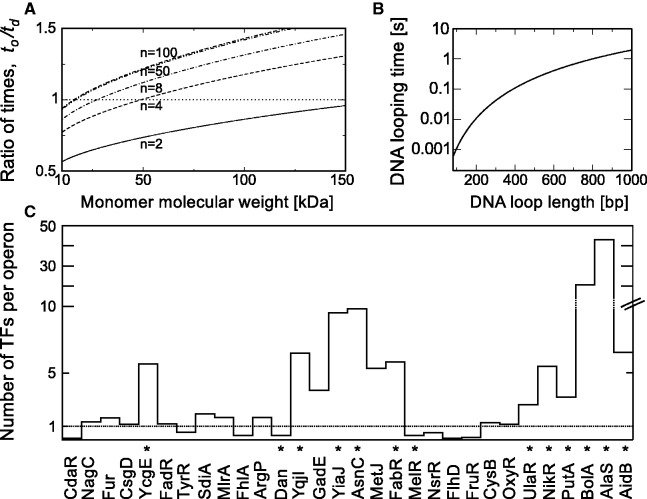
Figure 4.
Searching strategy for the formation of TF complex at the operator depends on the number of searchers. (A) Ratio,  , of the complex formation time via searching by oligomers (abundance n/o) to the time of independent searching by dimers (abundance n). Case with o = 2 (TF complex is a tetramer), and two independent specific sites on DNA within operator region (m = 2). (B) DNA looping times as a function of base pairs that form a loop for in vivo macromolecular crowding. The time calculation is based on DNA relaxation times (71,72) of size L from
  . The hydrodynamic radius of DNA is
  with
with  and
and  (73) and molecular weight of the 1 bp is 660 Da. The viscosity η experienced by moving DNA is calculated as previously (14). (C) Mean number of oligomeric TFs per regulated operon. Data are taken from single-molecule studies of protein copy number in E. coli cell (37). The dotted line corresponds to the ratio value equal to 1. By means of stars we marked TFs that regulate only one or two operons.

