Figure 6.
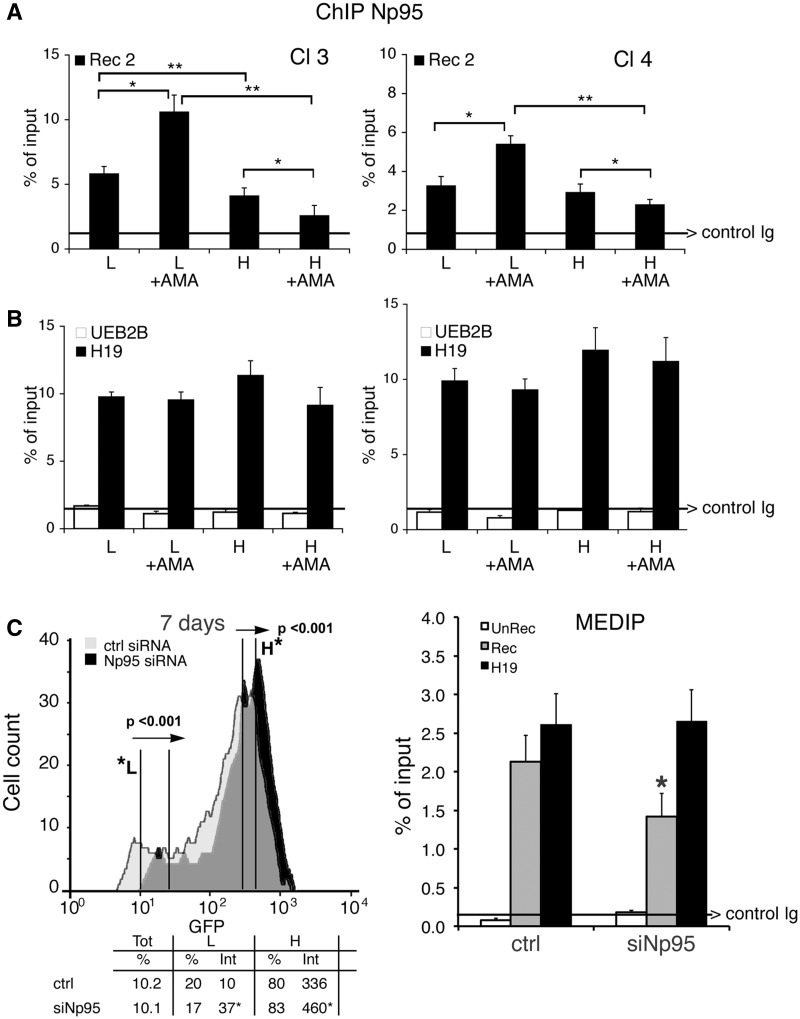
Np95 (UHRF1) is recruited to repaired GFP and stimulates DNA methylation. (A) ChIP with anti-Np95 antibodies of sorted cells exposed to α-amanitin during repair. Clones 3 and 4 were transfected with I-SceI and treated with α-amanitin for 24 h as described in Figure 2. The cells were sorted 5 days after I-SceI transfection and chromatin was collected from formaldehyde-fixed cells and subjected to ChIP analysis with specific antibodies to Np95. Primers Bcg and Rec2 were used to amplify recombinant GFP DNA. The data derive from three independent experiments performed in triplicate (mean ± SD; n = 9). Differences between treatments were tested for statistical significance using Student’s matched pair t-test: *P < 0.01 as compared with the each control (α-amanitin treated versus untreated cells). Differences between cells (H versus L) were tested for statistical significance using Student’s t-test: **P < 0.01. (B) ChIP analysis of Np95 on H19 DMR and UBE2B genes. qPCR was carried out with specific H19 DMR and UBE2B primers on the same samples indicated above. The fraction of immunoprecipitated DNA by control Ig is reported on each bar graph. (C) DRGFP cells (pool of clones; clone 3 and 4 are not shown here) were transiently transfected with a mixture of siRNAs targeting specifically human NP95 or control scrambled siRNA (ctrl) and the mouse I-SceI expression vector (see ‘Materials and Methods’ section). Six days later, the cells were subjected to FACS analysis and MEDIP. The left panel shows a representative experiment: arrows indicate the shift in silenced cells of GFP fluorescence intensity. The columns below the fluorescence plot show (i) the number of GFP+ cells (Tot, expressed as percentage of cells); (ii) the mean fluorescence intensity (Int.); and (iii) Percentage of L and H cells on GFP+ cells. Mean fluorescence intensity at day 7 increased from 10 to 37 in L cells and from 336 to 460 in H cells (left panel). FACS analysis was performed in triplicate in at least three experiments. Differences between treatments were tested for statistical significance using Student’s matched pair t-test: *P < 0.001 as compared with the each control (siRNA-treated versus untreated cells). Samples expressing NP95 wild-type and control cells were treated with 1 µM 5azadC for 1 day (48 h after I-SceI), and the differences in fluorescence intensity was used to quantify methylation-dependent changes of GFP expression. The panel on the right shows the results of MEDIP immunoprecipitation with anti-5mC antibodies in control and siRNA-treated samples. Np95 depletion by siRNA did not modify the methylation status of stably methylated genes, such as H19 (DMR) and β-actin CpG island. *P < 0.01 for t-value (matched pair test) relative to the cells treated with control scramble siRNA (CTRL). Data are expressed as mean ± SD, n = 9; the average of immunoprecipitated DNA with a control Ig is reported on the bar graph.

