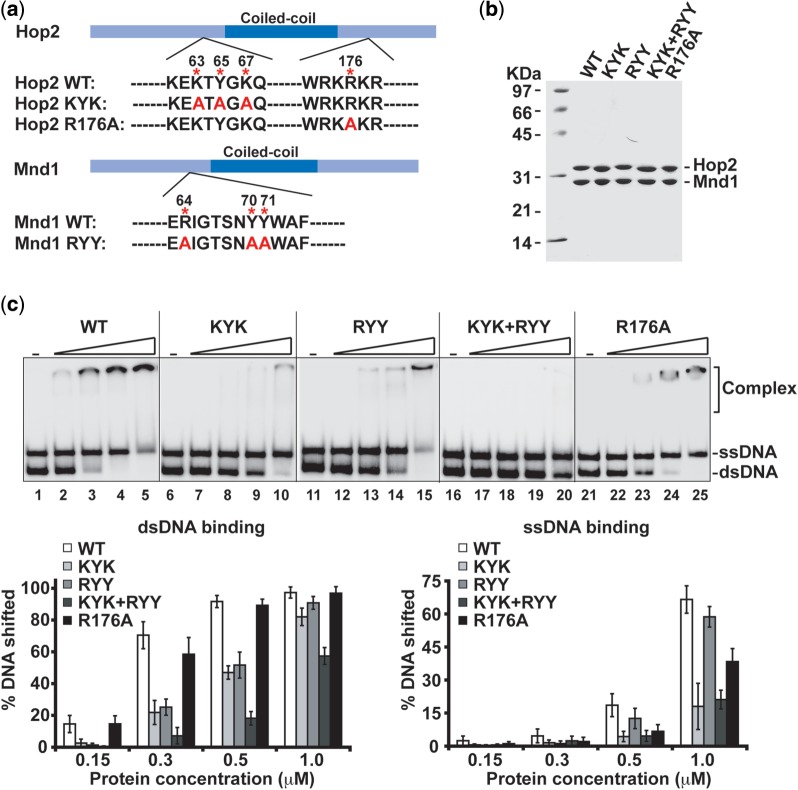
Figure 2.
DNA binding properties of point mutants of the Hop2–Mnd1 complex. (a) Mutants of Hop2 and Mnd1 made in this study. (b) SDS-PAGE analysis of purified Hop2–Mnd1 and mutant complexes. (c) Analysis of WT and mutant variants of Hop2–Mnd1 (KYK, RYY, KYK + RYY and R176A) (0.15, 0.3, 0.5 and 1.0 µM) for DNA binding. The mean values ± SD from three independent experiments were plotted.

