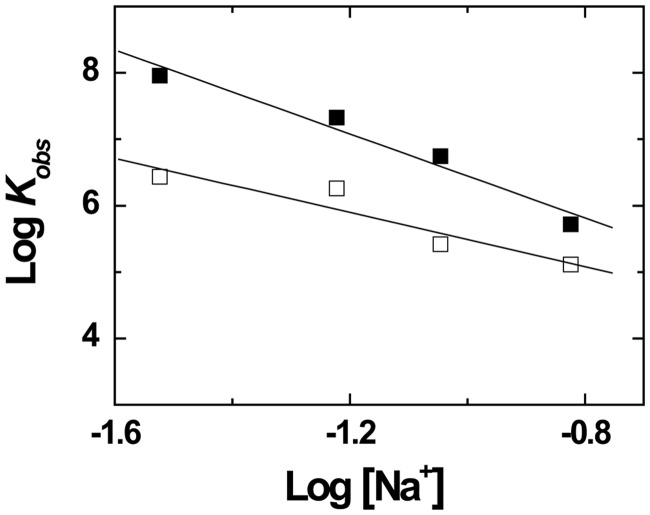
Figure 2.
Salt dependence of the binding of Tat(44–61) and Tat(44–61)ac to cTAR. The binding experiments were performed by adding increasing concentrations of Tat(44–61) (closed squares) or Tat(44–61)ac (open squares) to 10 nM cTAR-3'-Fl in 25 mM Tris buffer (pH 7.5), 0.2 mM MgCl2 and the NaCl concentrations indicated on the X-axis. The binding process was monitored by steady-state fluorescence anisotropy, as described in ‘Materials and Methods’ and Supplementary Figure S1 in the Supplementary Materials. The apparent association constant, Kobs, for each titration was obtained using Equation (1). The solid lines correspond to the fits of the data points to Equation (3), using the parameters given in the text.

