Figure 4.
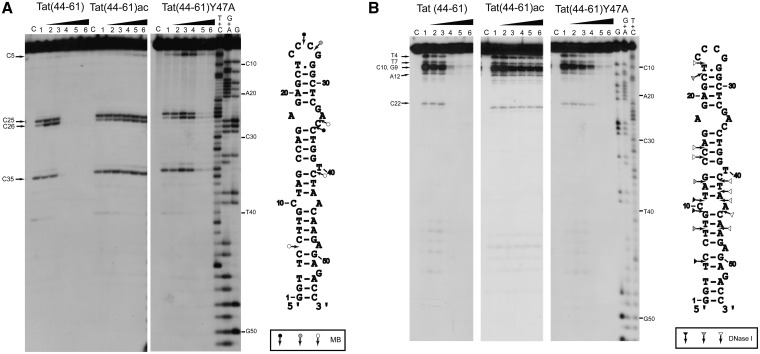
Footprinting analysis of the complexes of cTAR with Tat peptides using MB nuclease (A) and DNase I (B). Footprinting experiments were performed as described in ‘Materials and Methods’. The 3′-end-labeled cTAR DNA was incubated with MB (2 units) or DNase I (0.1 unit) in the absence (lanes 1) or in the presence of the peptides (lanes 2–6). The peptide to nucleotide molar ratios were 1:8 (lanes 2), 1:4 (lanes 3), 1:2 (lanes 4) 1:1 (lanes 5) and 2:1 (lanes 6). Lanes C are controls without peptide and endonuclease. The G, G+A and T+C refer to Maxam–Gilbert sequence markers of cTAR run in parallel to identify the cleavage sites. Arrows indicate the cleavage sites. Closed, gray and open symbols indicate strong, medium and weak cleavage sites in the absence of peptide, respectively.

