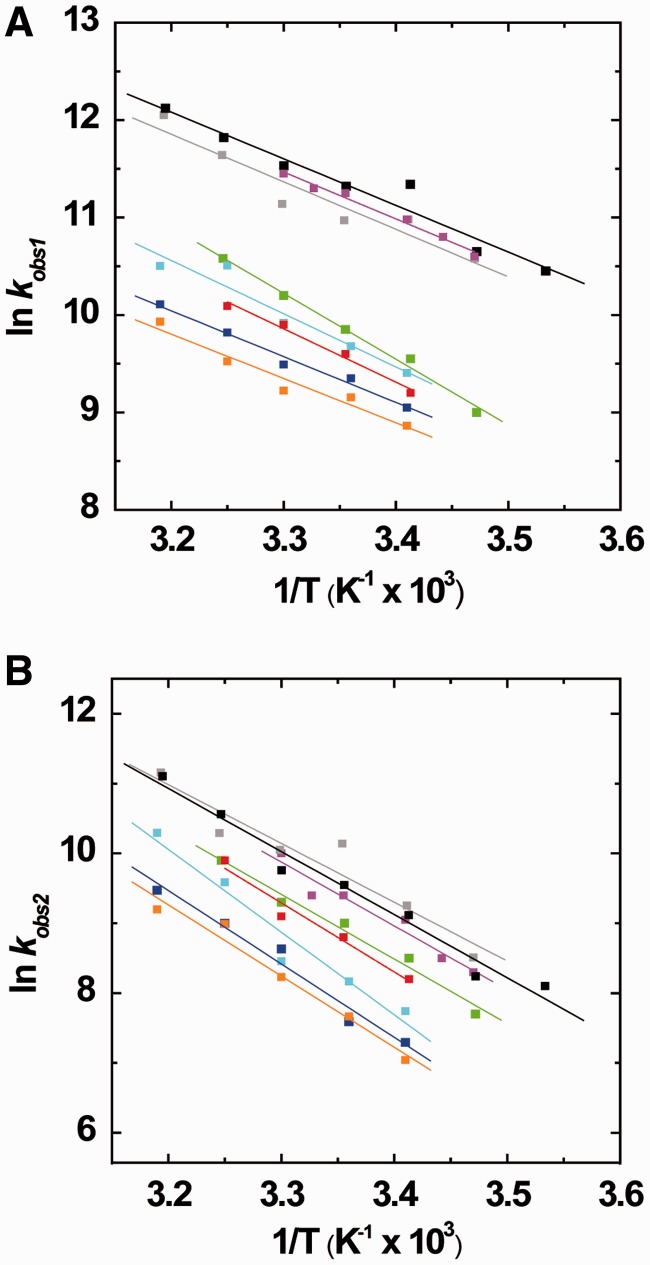
Figure 7.
Arrhenius analysis of the annealing of cTAR to dTAR in the presence of Tat (44–61) derivatives. Temperature dependence of kobs1 (A) and kobs2 (B) for the reaction of 10 nM TMR-5′-cTAR-3′-FL with 100 nM dTAR in the presence of Tat(44–61) (black), Tat(44–61)Q54A (gray), Tat(44–57) (magenta), Tat(44–61)Y47A (green), Tat(44–61)R52A,R53A (cyan), Tat R55A,R56A (blue), Tat(50–61) (orange) or Tat(44–61) acetylated (red). The straight lines represent the best fits of the data to Equation (5).

