Figure 2.

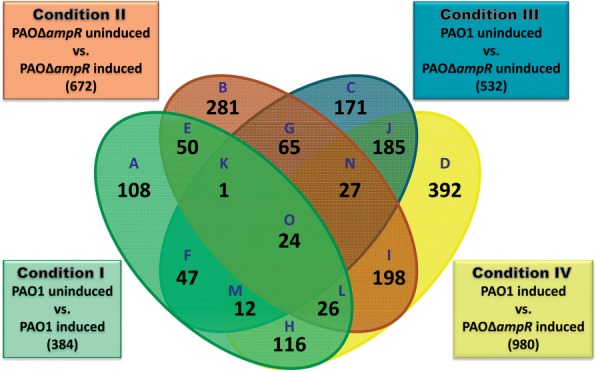
Venn diagram of differentially regulated genes. Distribution of significantly (P ≤ 0.01) regulated genes (≥2.0-fold) in PAO1 and PAOΔampR without (uninduced) and with (induced) sub-MIC β-lactam stress.

Venn diagram of differentially regulated genes. Distribution of significantly (P ≤ 0.01) regulated genes (≥2.0-fold) in PAO1 and PAOΔampR without (uninduced) and with (induced) sub-MIC β-lactam stress.