
Figure 6.
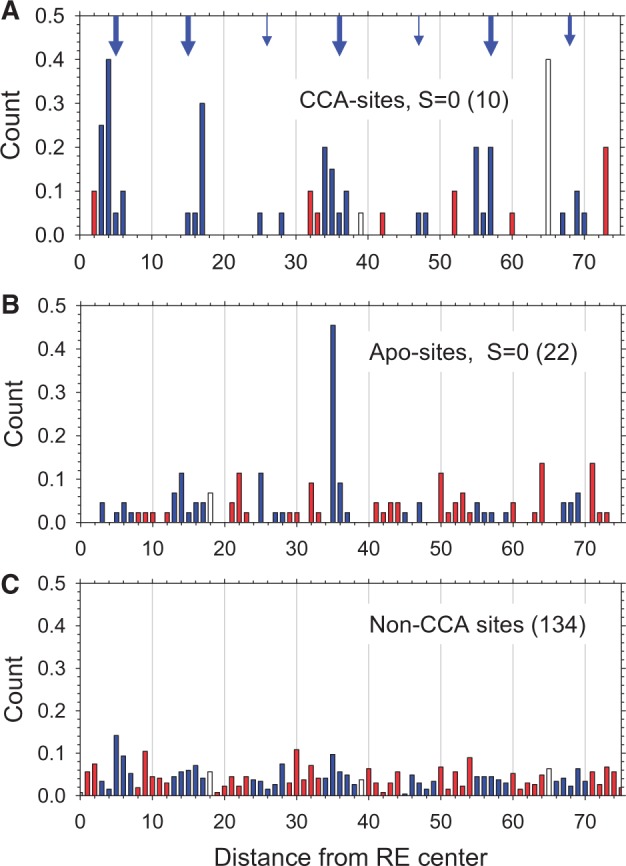
Distributions of the distances between nucleosome dyad positions and the centers of p53 REs for CCA-sites (A), Apo-sites (B) and 134 non-CCA sites (C). The 10 CCA-sites and 22 Apo-sites with spacer S = 0 are given in Supplementary Tables S1, S2. The 134 non-CCA sites were taken from Riley et al. (4). One hundred thirty-four million of the 147-bp-long human nucleosomal fragments published by Gaffney et al. (35) were used for this analysis. The data were averaged and symmetrized across the centers of the p53 sites. The ‘exposed’ positions are shown in blue, while the ‘buried’ positions are shown in red; the ‘intermediate’ positions 18, 39 and 65 are shown in white. The arrows indicate the ideally ‘exposed’ positions in nucleosome separated by multiples of 10.4 bp (59)—positions 5, 15, 26, 36, 47, 57 and 68 (Figure 2A). The sizes of the arrows reflect the ‘strengths’ of the peaks in the distribution.