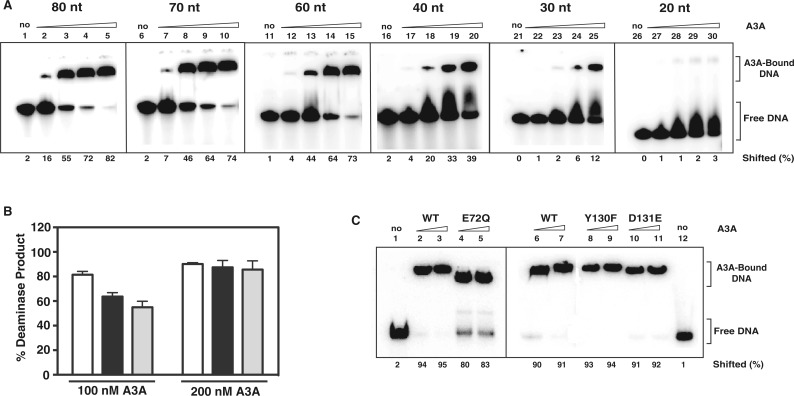
Figure 4.
A3A EMSA and deaminase assays with ssDNAs of different lengths. (A) Binding of A3A to TTCA-containing DNA oligonucleotides of varying lengths (20 nM) (Table 1): 80 nt (JL988); 70 nt (JL987); 60 nt (JL986); 40 nt (JL895); 30 nt (JL974); and 20 nt (JL975). Lanes: 1, 6, 11, 16, 21, 26, no A3A; 2, 7, 12, 17, 22, 27, 25 µM; 3, 8, 13, 18, 23, 28, 50 µM; 4, 9, 14, 19, 24, 29, 75 µM; 5, 10, 15, 20, 25, 30, 100 µM. The percentage of oligonucleotide bound to A3A is indicated at the bottom of the gel image as percent shifted. The positions of free oligonucleotide and shifted bands (A3A-bound nucleic acid) are also indicated. The calculations were performed as described in ‘Materials and Methods’. (B) Deaminase assays using 100 nM and 200 nM purified WT A3A and ssDNAs with different lengths (180 nM) (Table 1): JL1152 (20 nt, white bar), JL913 (40 nt, black bar) and JL1153 (60 nt, gray bar). (C) Binding of an 80-nt TTCA-containing ssDNA (JL988) by 60 μM (lanes 2, 4, 6, 8 and 10) or 80 μM (lanes 3, 5, 7, 9 and 11) A3A. Lanes: 1 and 12, no A3A; 2, 3, 6 and 7, WT A3A; 4 and 5, E72Q; 8 and 9, Y130F; 10 and 11, D131E. The positions of free and protein-bound DNA and the percent shifted are indicated.

