
Figure 7.
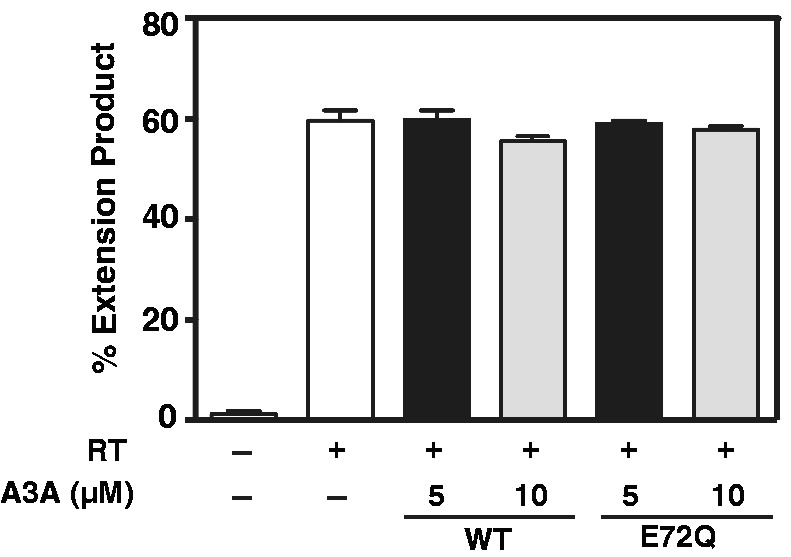
Effect of A3A on HIV-1 RT-catalyzed extension of a (−) SSDNA oligonucleotide. The bar graph shows the percent of DNA extension product without (−) or with (+) RT and/or A3A. The positive control reaction with RT only is shown as a white bar. Reactions with RT contain either 5 µM (black bar) or 10 µM (gray bar) A3A (WT and E72Q mutant).