Figure 2.
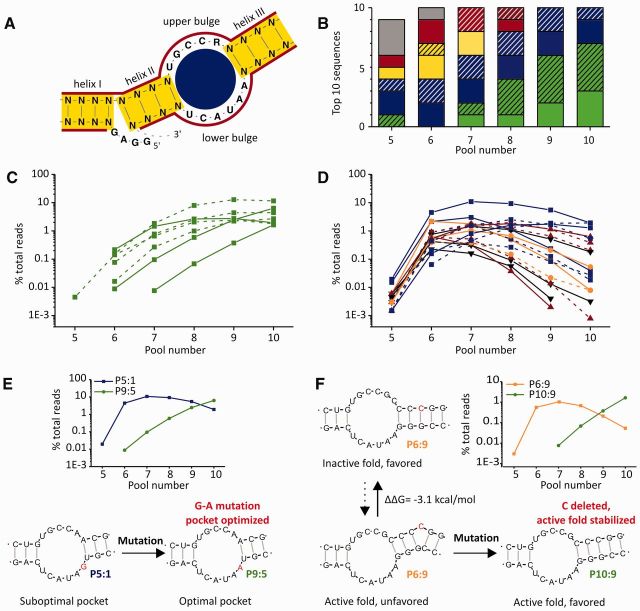
Sequence and structure evolution. (A) ‘Optimal’ typical DAse secondary structure and color-code for further panels. Blue: imperfect pocket, yellow: unstable helices, red: imperfect pocket and unstable helices, green: ‘optimal’ typical DAse, black/gray: no typical DAse fold. (B) Sequences found among the (maximum) 10 top ranking sequences in different pools, categorized by secondary structure prediction [hatched: energetically unpreferred, according to Mfold (29) secondary structure prediction]. (C and D) Abundance of all sequences found among the 10 top ranking sequences of each pool—either with ‘optimal’ typical DAse structure (C) or ‘suboptimal’ or atypical DAse structure (D), dashed lines represent energetically unpreferred typical DAse secondary folds. (E) Example of sequence evolution leading to optimization of the ribozyme’s catalytic pocket. (F) Example of sequence evolution leading to stabilization of an active fold.

