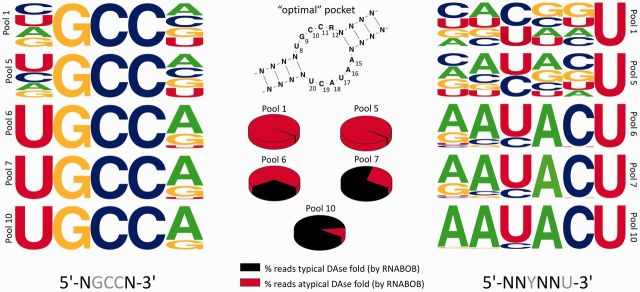
Figure 3.
Evolution of upper and lower bulge in the typical DAse ribozymes. Nucleotide conservation obtained by NGS of DAse selection pools. To analyze the evolution of these bulges, several pools were analyzed for the nucleotide conservation in the upper and lower bulge (shown as frequency plots). The secondary structure is showing the preferred nucleotide composition of typical DAse ribozymes, pie-charts show the fractions of sequence reads that have a typical DAse fold identified by RNABOB and the sequences shown below the frequency plot show random (black) and (semi-)conserved (gray) nucleotides, as used in the RNABOB descriptor (see Supplementary Text S4).

