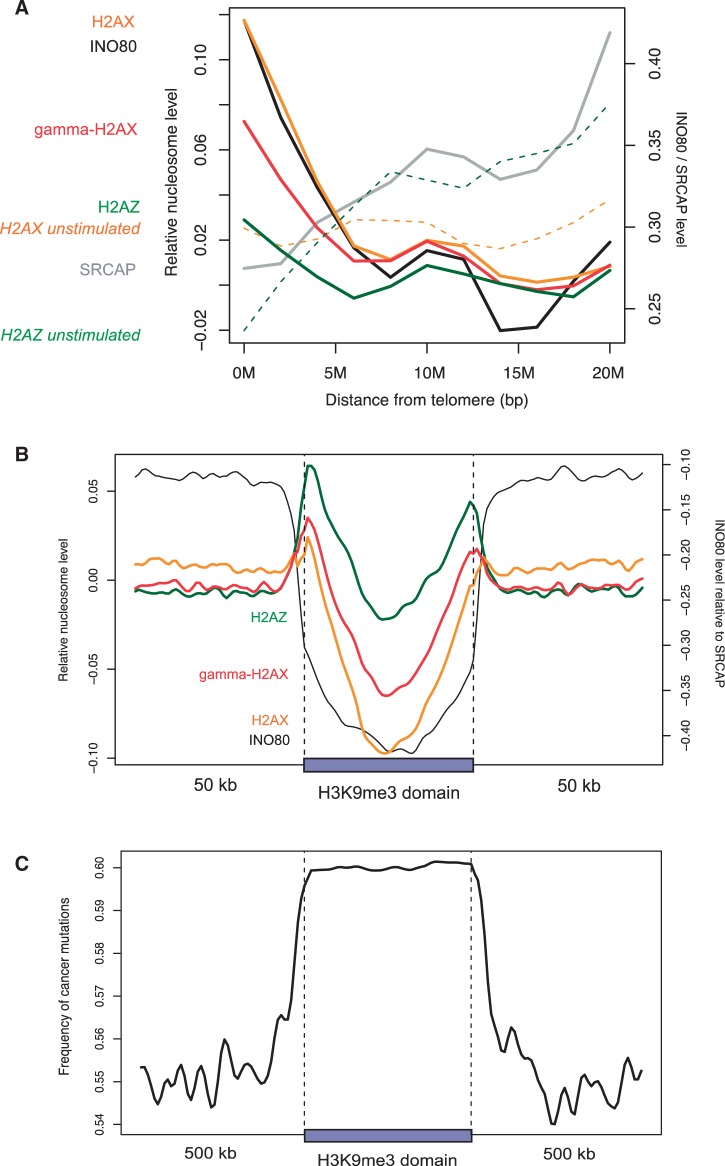
Figure 3.
Subtelomeric and heterochromatin patterns. (A and B) Normalized levels of H2AX and related molecules as a function of the distance to (A) chromosome ends and (B) H3K9me3 domains. To adjust for possible bias in the density of nucleosomes themselves, mononucleosome sequencing data in active T cells (21) were used to estimate the incorporation rate of H2AX, γH2AX and H2AZ. (C) The number of single nucleotide variations occurred in cancer (14) was counted in 10-kb windows and averaged across H3K9me3 domains.

