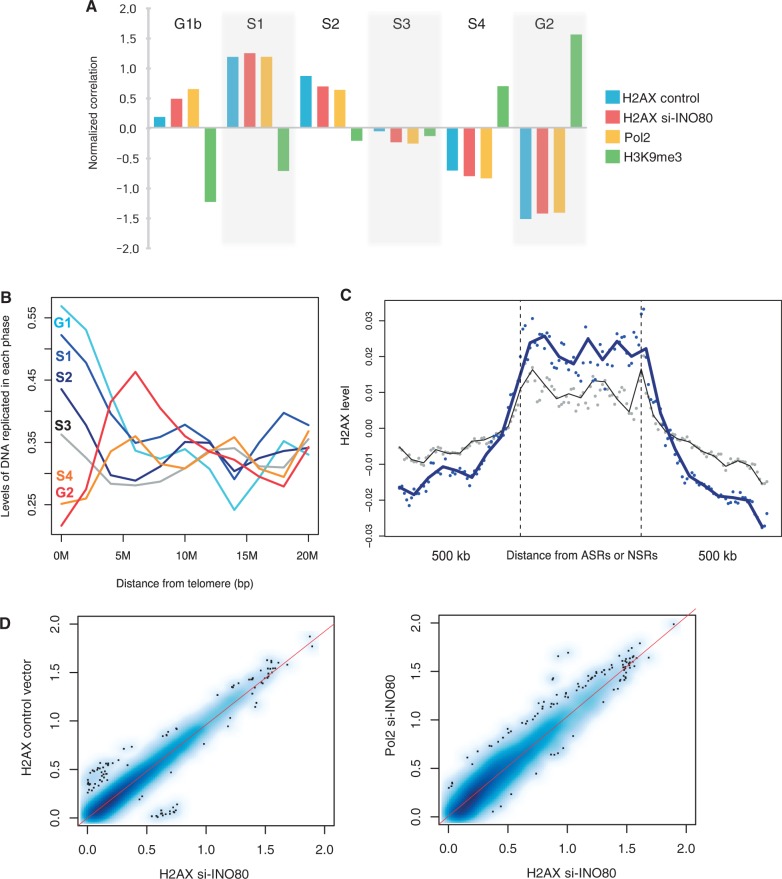
Figure 4.
Replication timing and INO80 knockdown in HeLa cells. (A) The overlapping of H2AX, Pol2 and H3K9me3 in HeLa cells with genomic regions replicated in each phase of the cell cycle. The correlations of normalized readcounts in 1-kb windows were scaled to 0 mean and unit variance across the six phases. (B) The distribution of DNA fragments that replicate in each phase of the cell cycle as a function of the distance to chromosome ends. A 4-Mb sliding window was used to obtain the 200-bp normalized readcount from each cell cycle fraction, which was then averaged over multiple chromosome ends. (C) Normalized levels of H2AX in HeLa cells as a function of the distance to ASRs (blue dots) and neocarzinostatin-sensitive regions (gray dots). Spline smoothing was performed to obtain the fitting curves (dark blue and black curves). (D) Genome-wide correlations between H2AX before and after INO80 silencing (left) and between H2AX and Pol2 in the INO80-knockdown cells (right).

