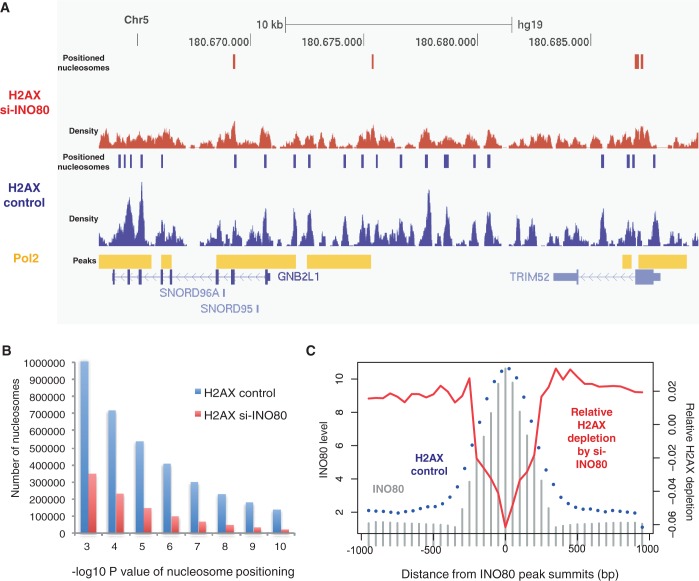
Figure 5.
Changes in H2AX nucleosome density on INO80 knockdown. (A) The vertical bars indicate nucleosome positions before and after INO80 depletion, as predicted based on the sequencing tag density shown below. The Pol2 peaks are shown above the annotated transcripts. (B) The number of H2AX mononucleosome molecules (y axis) in the wild-type (blue) and INO80-knockdown (red) cells according to the P-value of each nucleosome detection (x axis) estimated using Poisson approximation. (C) INO80 density in the active cells (gray bars), H2AX nucleosomes occupancy in the wild-type cells (blue dots) and relative H2AX depletion on INO80 silencing (red curve) shown according to the distance from the INO80 peak summits.

