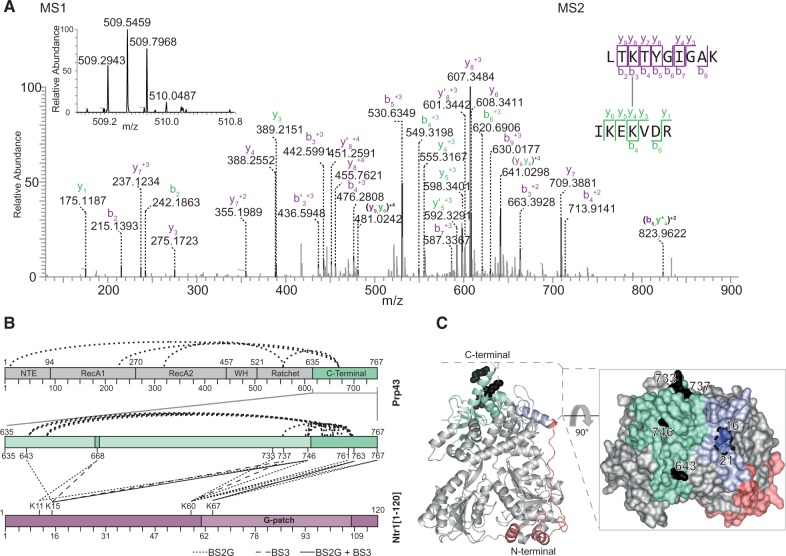
Figure 3.
Protein–protein cross-linking map and localization on the C-terminal domain of Prp43. (A) MS1 and MS2 spectra of cross-linked K60 in LTKTYGIGAK [Ntr1(1–120)] to K746 in IKEKVDR (Prp43). MS1 spectrum shows the isotopic envelope of the quadruply charged cross-linked peptide pair. The MS2 spectrum, zoomed in the region of 0–900 m/z for clarity, depicts the identified peptide fragments. (B) Cross-linking map depicts both intramolecular and intermolecular cross-links identified in Prp43-Ntr1(1–120). Dark green areas indicate regions not solved in the crystal structure. Both BS3 and BS2G cross-links are represented, with a full line for a cross-link identified in both, and differently dashed lines for those cross-links identified only with one particular cross-linker. Both cross-linkers, despite not fully overlapping, aim at the same cross-linked regions: the very C-terminal region of Prp43 and the beginning of the G-patch motif of Ntr1. (C) Localization of Prp43 cross-linked residues, and rotated surface representation. Residues cross-linked to Ntr1 are depicted in black, and the residues in the N-terminal domain determined to be protected in the footprinting studies are in blue.

