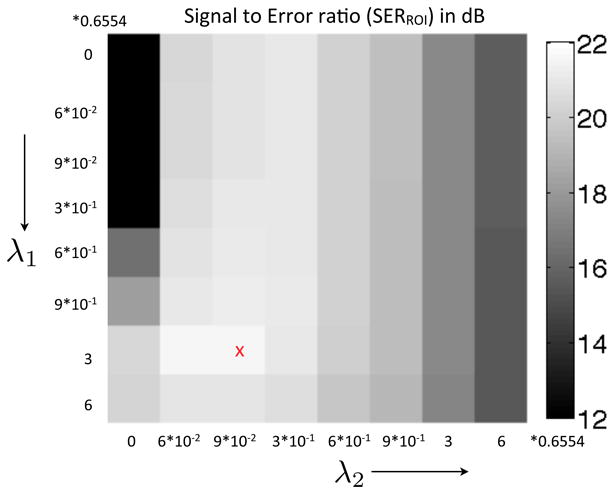
Figure 10.

Tuning of the regularization parameters λ1 and λ2. The SER was evaluated in a field of view containing the regions of the heart. The optimal parameters were chosen corresponding to the region where the SER between the reconstruction and the reference data set was maximum.
