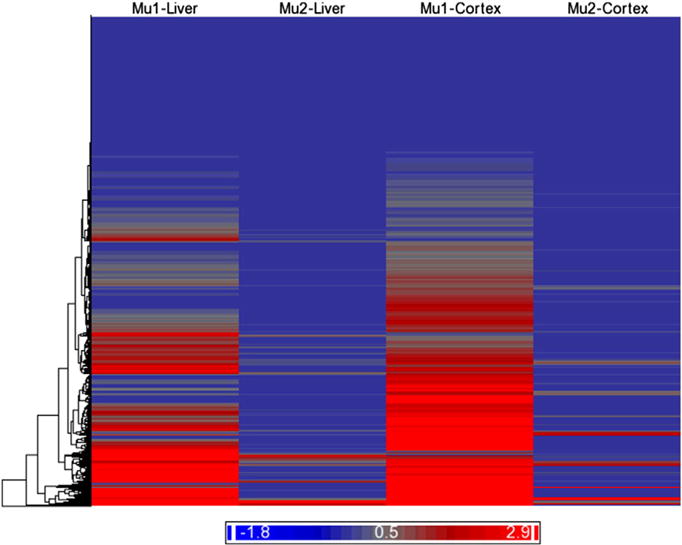
Fig. 2.

Clustering and heat map of transcripts by expression state. The columns represent the mean expression for the state with high-level (Mu1) or low-level (Mu2) transcripts within the 3′ UTR of the liver or cortex samples. The rows represent the 12,189 RefSeq transcripts group by Euclidean distance and average linkage. The color spectrum indicates the degree of expression as represented as the log2(x + 1) where x is the ratio of the mean of the expression state within a given tissue (liver or cortex) divided by the mean of the expression for all the states across both tissues.
