
Fig. 5.
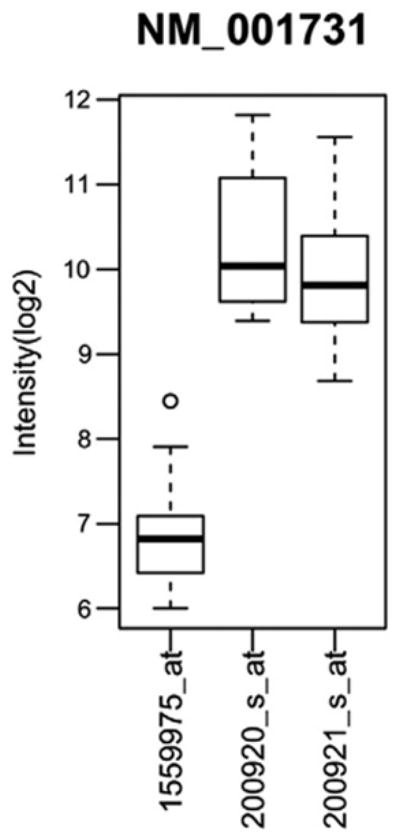
Microarray (Affymetrix) gene expression of 3′ UTR probes targeting the BTG1 gene. The BTG1 gene, represented by RefSeq accession# NM_001731, gene expression in terms of log2 intensity, is shown for 3 probesets designed to target this transcript: 1559975_at, 200920_s_at and 200921_s_at. The spread of the data is represented by box plots where the dark black horizontal line indicates the median, the bottom of the box indicates the lower quartile, the top of the box indicates the upper quartile and a circle to denote an outlier.