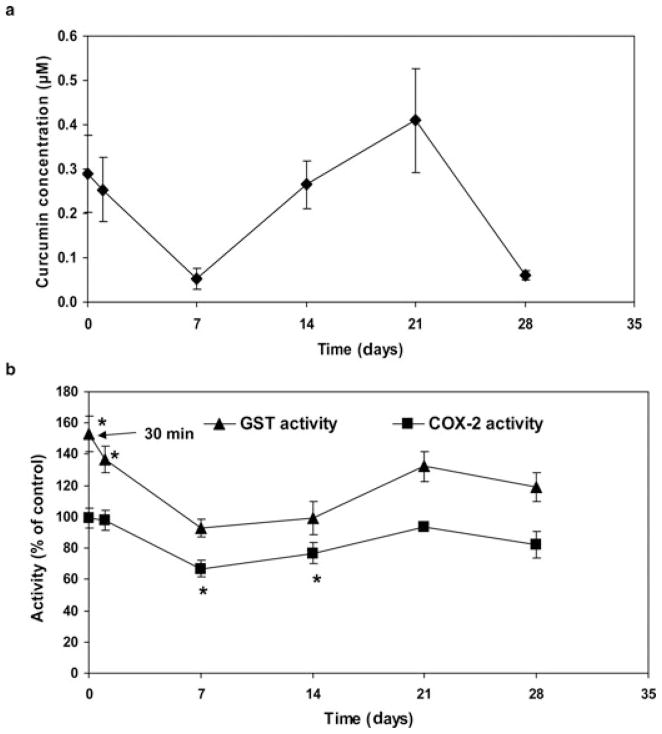
Figure 7.
(a) Liver concentrations of curcumin following a single dose of curcumin microparticles. (b) Hepatic GST and COX-2 activities following a single dose of curcumin microparticles. GST and COX-2 activities were determined using commercial assay kits, whereas curcumin concentrations were quantified by LC–MS/MS. Data shown are mean ± SE, n=6. *p < 0.05.

