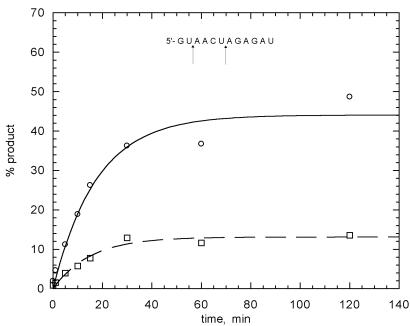
Figure 5.
Kinetic analysis of self-cleavage. Plots of percentage product versus time for self-cleavage of clone 32 sequence between nucleotides 2 and 3 (circles) and 6 and 17 (squares) indicated in the inset structure. For cleavage between nucleotides 2 and 3 and between 6 and 7, the rate constants were 0.07 ± 0.01 and 0.06 ± 0.01 min–1, with end points of 44 and 13%, respectively.

