
Fig. 2.
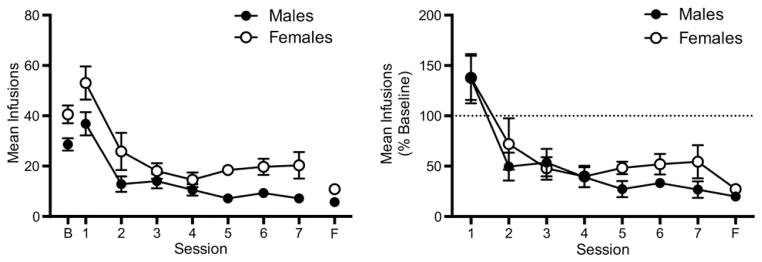
Mean (±SEM) number of infusions during saline extinction expressed as absolute values (left panel) and a percentage of the mean number of infusions earned during baseline (right panel). Each point is the mean of seven rats. Points above “B” represent the mean number of infusions during the last three sessions prior to extinction. Points above “F” represent values during the final extinction session at which extinction criteria were met.