
Fig. 8.
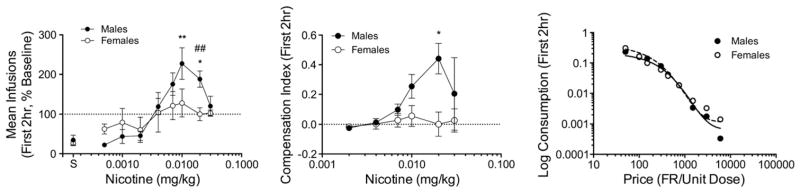
Data from the first 2 h of the session. The left panel shows the mean number of infusions at each unit dose. The middle panel shows the compensation index (CI) at each unit dose. The right panel shows exponential demand curves for consumption in the first 2 h of the session. See Figs. 3, 5, and 7, respectively, for further details.