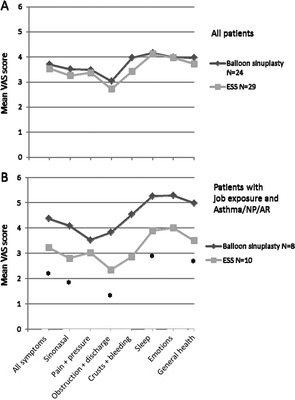
Figure 1.

(A) Comparison of mean visual analog scale (VAS) scores of change in symptoms between balloon sinuplasty and ESS groups in all patients and (B) in a subgroup having job exposure and asthma/previous nasal polyps/allergic rhinitis. The x-axis represents mean VAS scores change in symptoms (range, 0–10). We used the question “How much did the following symptoms change after the operation?” The value 0 (cm) indicated “recovered totally” and value 10 (cm) indicated “became as worse as it can be.” The y-axis represents the eight subscales that were the mean values of group-specific symptoms as shown in Table 1. Statistically significant differences are shown by asterisks (*p < 0.05) by Mann Whitney U test.
