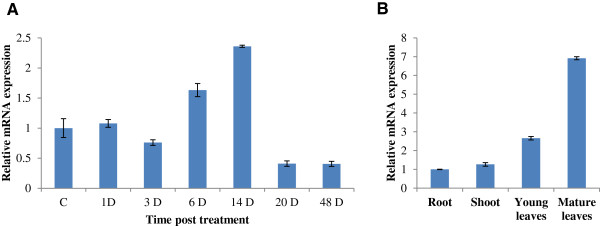
Figure 6.

Real time PCR analysis of EPSPS gene against glyphosate stress. qPCR analysis of EPSPS transcript showing their regulation in response to glyphosate treatment (A). Real time PCR analysis of EPSPS during post treatment of 2.16 mg/l glyphosate at different time points. (B). Relative mRNA expression of EPSPS gene in different parts of plant. The relative mRNA expression for each transcript was calculated in comparison to control plants. Bars indicate the standard error (± SE) calculated from three independent experiments.
