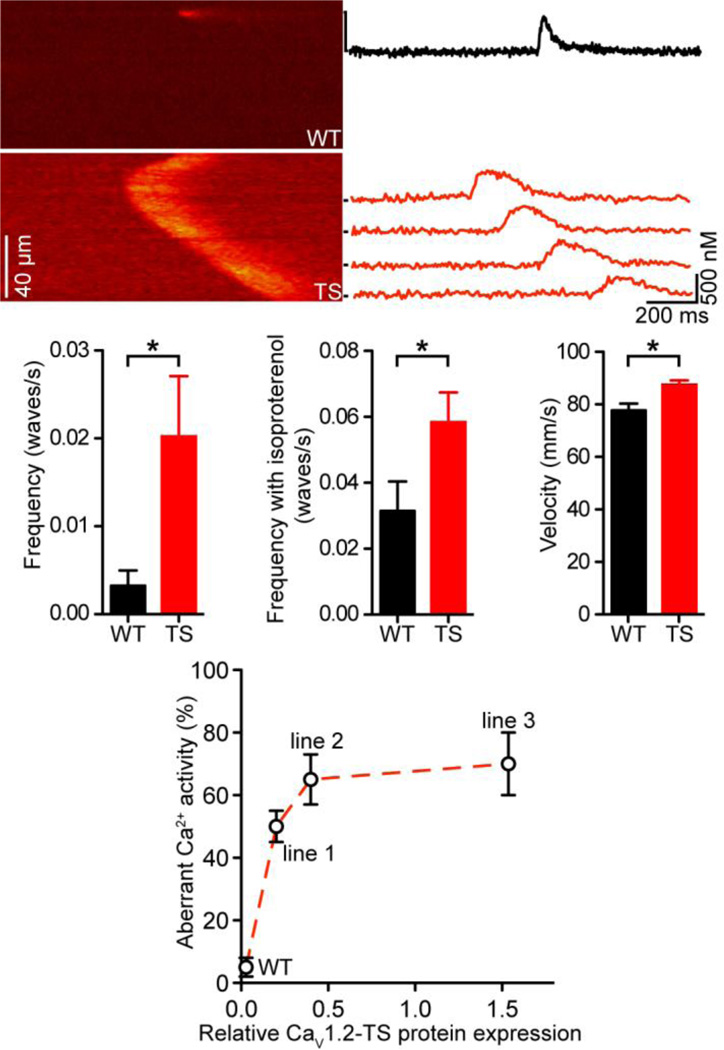
Figure 3. Higher Ca2+ wave activity in TS cells.
A, representative confocal line-scan images of a large spark in a WT cell (above) and a Ca2+ wave in a TS cell (below). [Ca2+]i (nM) plotted to the right for each line marked by black bars. B–D, bar plots of the mean ± S.E.M. of the frequency (B), frequency upon application of 100 nM isoproterenol (C), and velocity (D) of Ca2+ waves in WT and TS myocytes. E, plot of relative CaV1.2-TS expression (x-axis) vs. frequency of aberrant Ca2+ activity (%) (y-axis).

