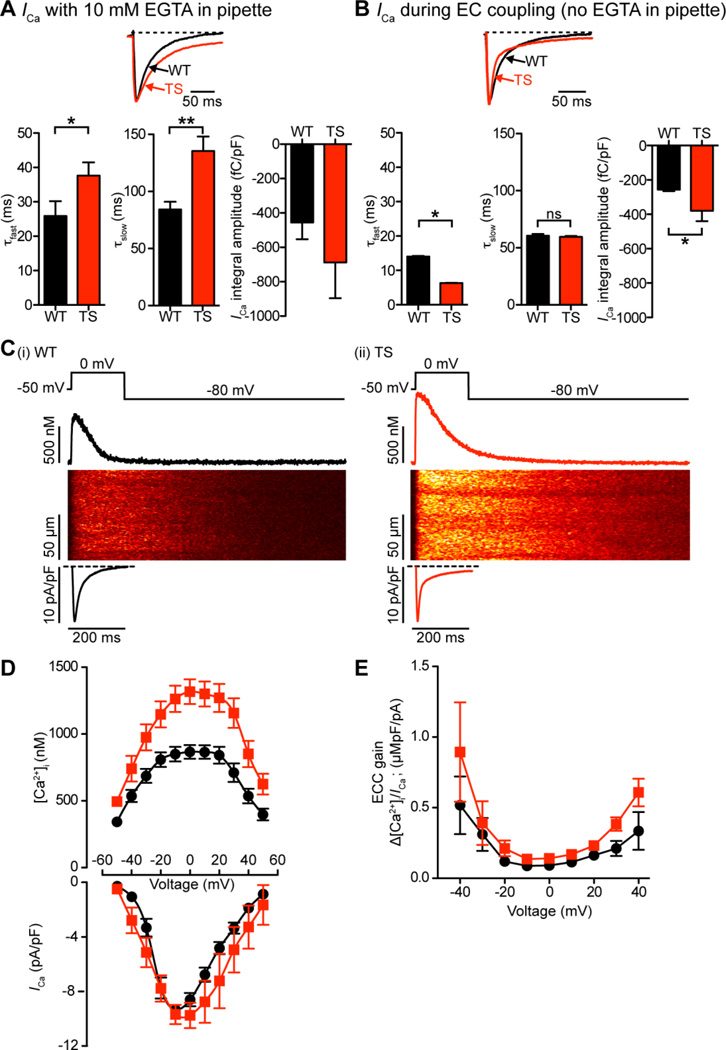
Figure 5. Higher SR Ca2+ release during EC coupling in TS cells increases the rate of inactivation of ICa.
A–B, representative ICa records normalized to peak from TS and WT myocytes dialyzed with an intracellular solution containing (A) or lacking (B) 10 mM of the Ca2+ chelator EGTA. Currents were evoked by a voltage step from −50 mV to 0 mV in the presence of 2 mM external Ca2+. Below, bar plots of the mean ± S.E.M. of the inactivation components of ICa: τfast (ms), τslow (ms), and current integral (fC/pF) in WT and TS myocytes. C, representative ICa and confocal line-scan images from WT (i) and TS (ii) cells. ICa and [Ca2+]i transients were evoked by a 200 ms voltage step from −50 to 0 mV. Traces showing the time course of ICa and [Ca2+]i in these cells are shown below and above the line-scan images, respectively. D, voltage dependence of the amplitude of the [Ca2+]i transient on positive y-axis, current-voltage relationship of ICa on negative y-axis, for both WT (black) and TS (red) cells. E, voltage dependence of EC coupling (ECC) gain for WT (black) and TS (red).

