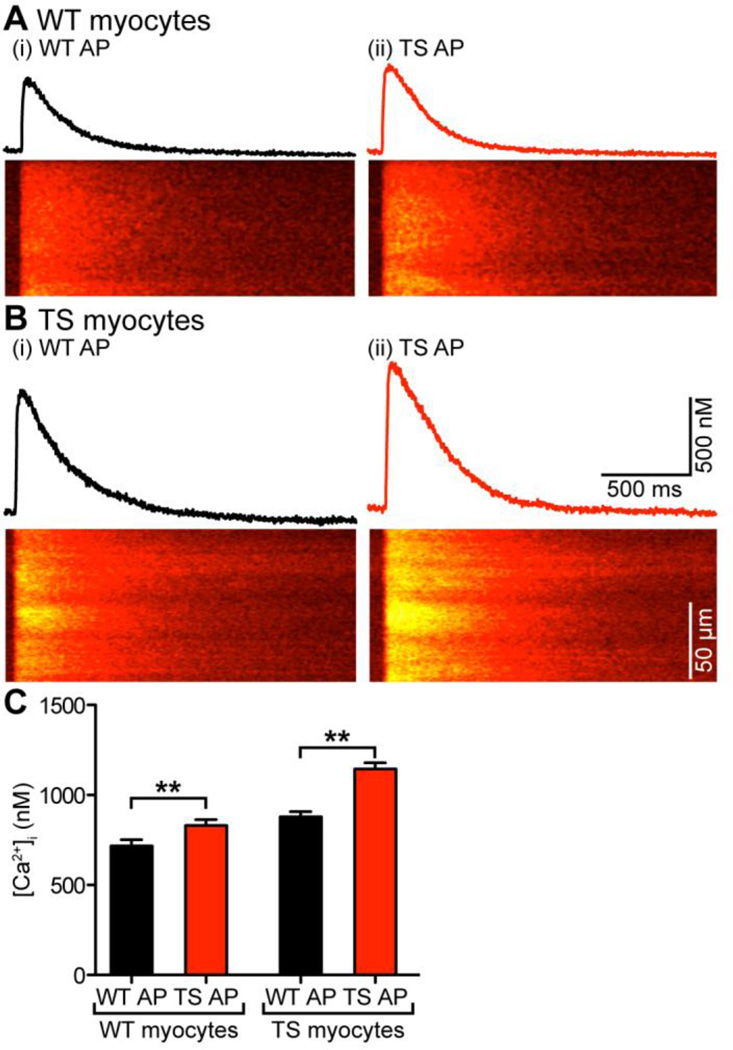
Figure 7. Differences in AP waveform contributes to differences in [Ca2+]i between WT and TS myocytes.
A–B, [Ca2+]i transients and confocal line-scan images from a representative WT (A) and TS myocyte (B) stimulated with the WT AP (i) or TS AP (ii). C, bar plot of the mean ± S.E.M. of the amplitude of the [Ca2+]i transient in WT and TS myocytes stimulated with the WT or TS APs.

