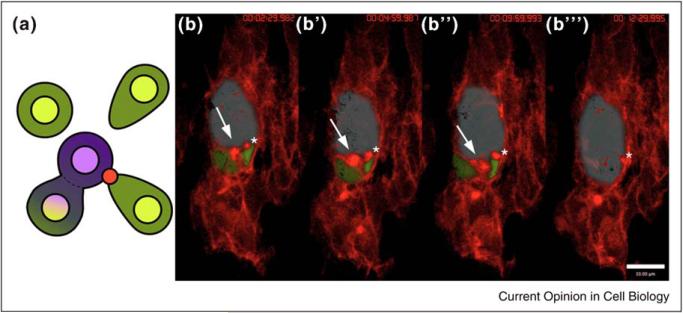
Figure 2.
The site of myoblast fusion is marked by an actin focus. (a) Schematic of myoblast fusion showing fusion between a myotube (purple) and fusion competent myoblasts (green). Note shape changes in FCMs and actin focus (red dot). (b–b′′′) Stills from time-lapse imaging reveal the progress of fusion events. Time stamps: (b) 00:02:29.982; (b′) 00:04:59.987; (b′′) 00:09:59.993; (b′′′) 00:12:29.995. An actin focus is present at each fusion site. Myotube false colored blue; FCMs false colored green. Actin (red) revealed by moesin-mcherry expressed specifically in the muscle mesoderm (using twist-GAL4). Stage 14 embryo, extended focus view of 10, 0.5 μm z-slices, frame rate is 2.30 min. Elapsed time shown upper right. Arrow points to one actin focus, asterisk to a second. Two others are also present below the false-colored myotube.

