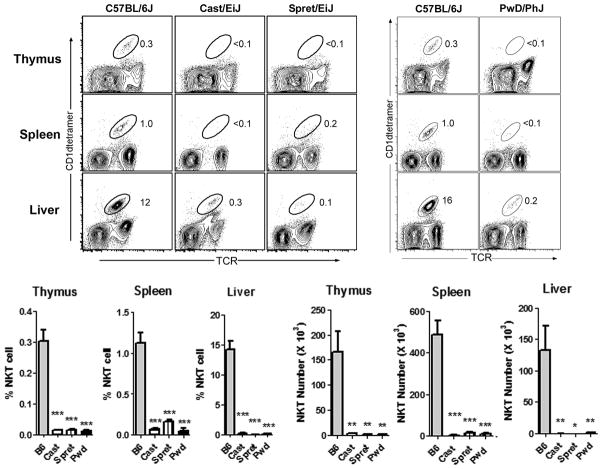
Fig. 1. Severe deficiency NKT cell numbers from divergent Mus species.
Thymus, spleen, and liver NKT cells numbers were calculated by flow cytometry after staining with anti-TCRβ and CD1dtetramer/PBS57. Representative FACS contour plots depicting the percentages of NKT cells in the different organs are shown at top. The NKT cell population is circled, and the percentages are indicated. Percentages for thymus and spleen are of total cells, while percentages for liver are of CD45+ IHLs. Cumulative percentages and numbers of NKT cells in the different organs are shown at bottom. Data represent the means ± s.d., n = 4–5 mice per strain, *p ≤ 0.01, **p ≤ 0.01, ***p ≤ 0.001.

