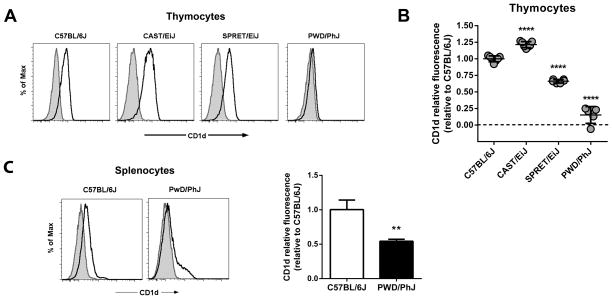
Fig. 2. Impaired CD1d expression in PWD mice.
(A) Comparison of thymocyte CD1d cell surface expression among inbred mouse strains. Representative histograms are shown. Shaded histograms represent isotype-matched control mAb staining. Open histograms represent anti-CD1d staining. (B) Relative thymocyte CD1d fluorescence among different inbred strains relative to C57BL/6J. Relative CD1d fluorescence was calculated as specified in Materials and Methods. Data represent the mean relative fluorescence ± s.d., n = 5 – 7 mice per strain, ****p<0.0001. (C) Comparison of CD1d expression between B6 and PWD splenocytes. Representative histograms are shown at left. Shaded histograms represent isotype-matched control mAb staining. Open histograms represent anti-CD1d staining. PWD splenocyte CD1d fluorescence relative to C57BL/6J is shown at right. Data represent the mean relative fluorescence ± s.d., n = 3 mice per strain, **p<0.01.

