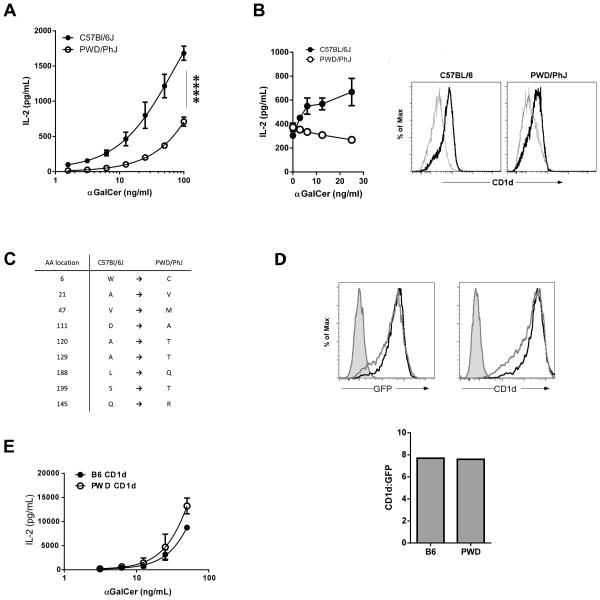
Fig. 3. Impaired antigen presentation by PWD CD1d.
(A) Comparison of B6 and PWD thymocyte antigen presentation. B6 and PWD thymocytes were cultured with the 2C12 NKT hybridoma and varying amounts of αGalCer, after which NKT IL-2 secretion into the supernatant was assessed by ELISA. Data represent the mean IL-2 ± s.d., and are representative of two separate experiments. Incubation of B6 or PWD thymocytes with αGalCer alone did not result in the secretion of detectable levels of IL-2 (data not shown). **** p < 0.0001. (B) Comparison of B6 and PWD BMDC antigen presentation. (Left) BMDCs generated from B6 or PWD bone marrow were pulsed with varying amounts of αGalCer, after which they were co-cultured with the 2C12 NKT hybridoma. NKT IL-2 secretion into the supernatant was assessed by ELISA. Data represent the mean IL-2 ± s.d. (Right) Comparison of CD1d expression between B6 and PWD BMDCs. Grey histograms represent isotype-matched control mAb staining. Black histograms represent anti-CD1d staining. (C) Location of non-synonymous substitutions in PWD CD1d. Position 1 indicates the methionine in the signal sequence. (D) Comparison of B6 and PWD CD1d expression in NIH3T3 transfectants. B6 and PWD CD1d-IRES-GFP constructs were stably transfected in NIH 3T3 cells. Cells were sorted based on GFP expression to equalize expression. Sorted cells were stained with anti-CD1d, and expression was assessed using flow cytometry. (Left) Shaded histograms represent control staining. The black histograms represent B6 GFP expression or CD1d staining, while the gray histograms represent PWD GFP expression or CD1d staining. (Right) Comparison of the ratios of CD1d:GFP expression of B6 and PWD CD1d transfectants. (E) Evaluation of PWD CD1d polymorphisms on antigen presentation. NIH3T3 CD1d transfectants, expressing equal amounts of B6 or PWD CD1d, were pulsed with varying amounts of αGalCer, after which they were co-cultured with the 2C12 NKT hybridoma. NKT IL-2 secretion into the supernatant was assessed by ELISA. Data represent the mean IL-2 ± s.d.

