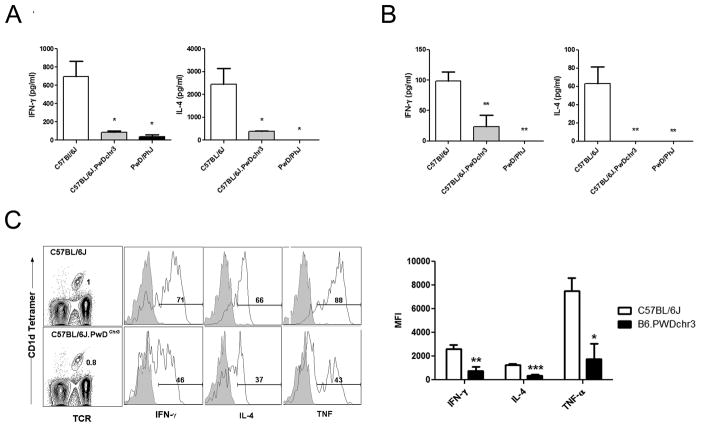
Fig. 5. Impaired response to αGalCer in B6.PwDchr3 consomic mice.
(A) Comparison of serum cytokine levels among strains 90 min after i.p. αGalCer administration. (B) Comparison of ex vivo splenocyte cytokine production 90 min. after i.p. αGalCer administration. (C) Representative FACS data depicting intracellular cytokine staining by spleen NKT cells after i.p. αGalCer administration. Histograms depict intracellular cytokine staining of gated NKT cells. Shaded histograms represent isotype-matched control mAb staining, while open histograms represent the anti-cytokine staining. The percentage of NKT cells positive for cytokine production is indicated. Intracellular cytokine production in PWD NKT cells could not be determined because of the low number of cells. Cumulative MFIs of NKT cell intracellular cytokine staining is shown at right. Data represent the mean MFI ± s.d., n = 3–4 mice per strain, *p ≤ 0.01, **p ≤ 0.01, ***p ≤ 0.001.

