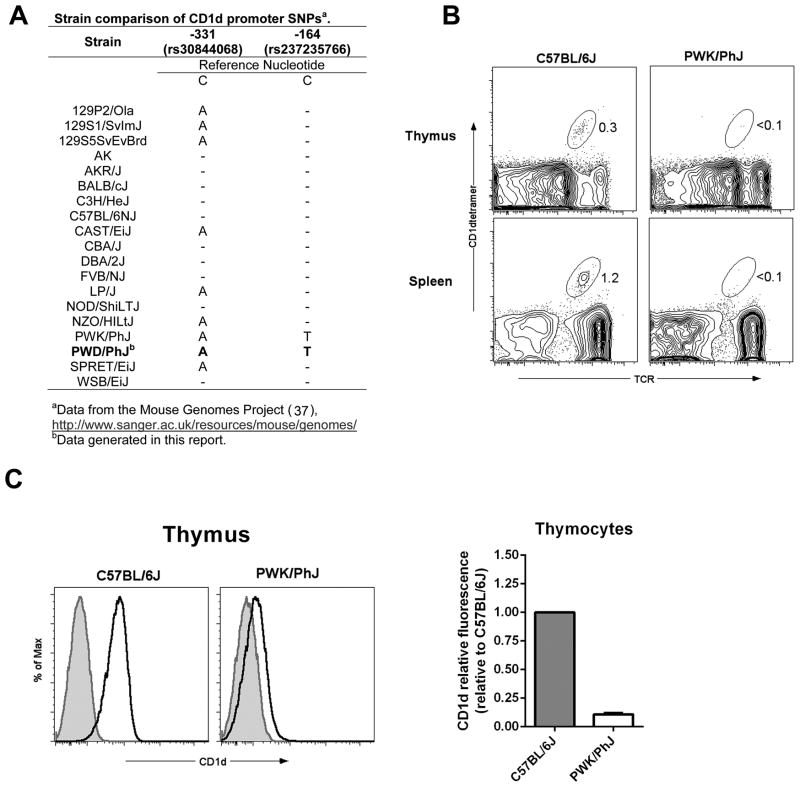
Fig. 7. Association of promoter SNPs with impaired CD1d expression and low NKT cell numbers in PWK/PhJ mice.
(A) Strain distribution pattern of the -331 (C/A) and -164 (C/T) nucleotide substitutions in the CD1d1 gene. (B) Comparison of thymic and spleen NKT cell frequencies between B6 and PWK/PhJ mice. Representative FACS contour plots depicting the percentages of NKT cells in the different organs are shown. The NKT cell population is circled, and the percentages are indicated. (C) Comparison of thymocyte CD1d expression between B6 and PWK/PhJ mice. Representative histograms are shown at left. Shaded histograms represent isotype-matched control mAb staining. Open histograms represent anti-CD1d staining. Relative thymocyte CD1d fluorescence in PWK/PhJ relative to C57BL/6J is shown at right. Relative CD1d fluorescence was calculated as specified in Materials and Methods. Data represent the mean relative fluorescence ± s.d., n = 2 – 3 mice per strain.

