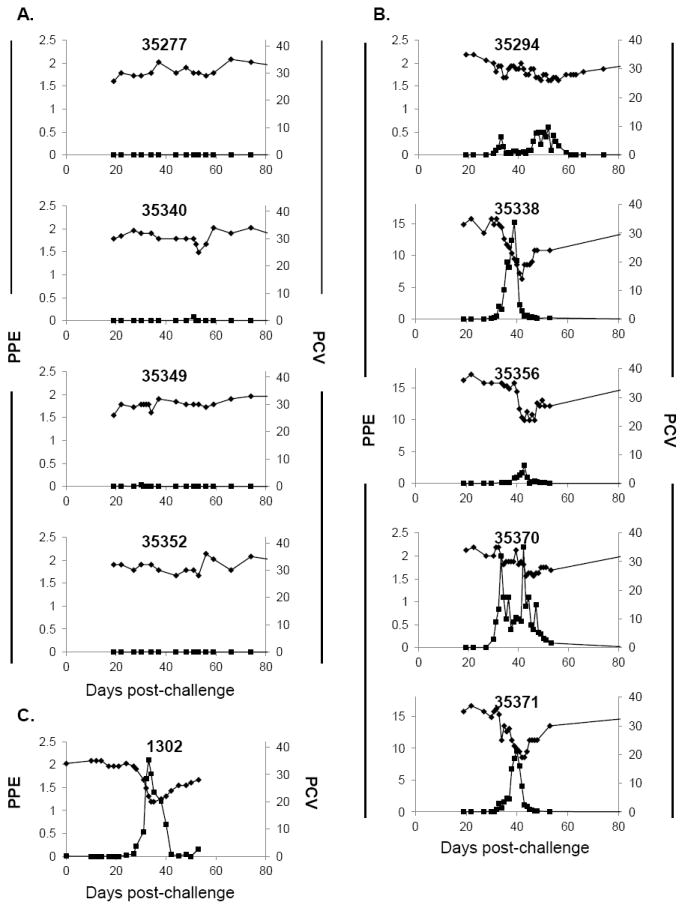
Figure 3.

Clinical parameters following challenge with AmStM. (A) Calves inoculated with AmStM-GFP (n=4), (B) naïve calves (n=5) and (C) A. centrale inoculated calf (n=1). Animal identification numbers are indicated on each panel. The x-axis indicates days post-challenge where day 0 is the day of tick application (A, B) or needle challenge (C). Bacteremia (left axis, ■) is reported as percent parasitized erythrocytes as determined by microscopic evaluation of Giemsa-stained blood smears. PCV (right axis, ◆) was used to evaluate anemia during infection. Axes values have been standardized to allow comparison between graphs, with the exception of the left Y-axis for 35338, 35356 and 35371 in B, which were altered to accommodate higher PPE values.
