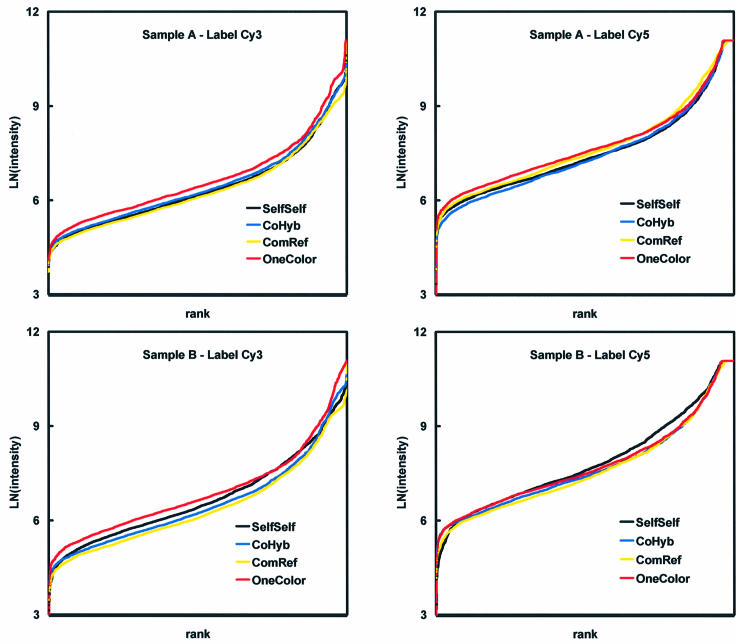
Figure 1.
Effect of hybridization design on signal intensity distributions. The LN-transformed background-corrected Cy3 and Cy5 signal intensities from samples A and B, observed in the co-hybridizations (CoHyb, arrays 1 and 2, pink), hybridizations with the common reference (ComRef, arrays 3–6, yellow), one-colour hybridizations (OneColour, arrays 7–10, red) and self–self hybridizations (SelfSelf, arrays 11 and 12, blue), were ranked in rising order and plotted. The Cy5 signal levels off at high intensities due to scanner saturation.

